
Advanced Placement (AP), 12.10.2020 19:01 miraclewhipppp
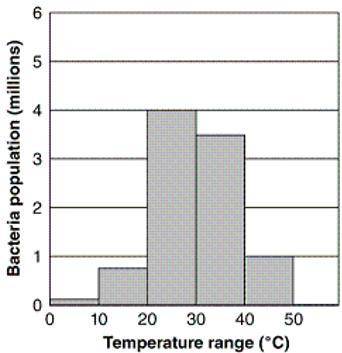
The following bar graph shows the population of bacteria under different temperature ranges.
What can be concluded about the bacteria from reading this graph?
Group of answer choices:
They prefer warmer temperatures to cooler temperatures.
They cannot tolerate temperatures above 50°C.
They thrive at exactly 30°C.
They prefer temperatures between 20°C and 30°C.

Answers: 2


Another question on Advanced Placement (AP)
Advanced Placement (AP), 22.06.2019 12:30
In the northern hemisphere what is the direction of the surface wind circulation in a high pressure system
Answers: 3
Advanced Placement (AP), 25.06.2019 20:00
Long-term alcohol use can cause major depression. a. true b. false
Answers: 2
Advanced Placement (AP), 26.06.2019 07:30
What type of commercial speech is not protected by the 1st amendment?
Answers: 1
Advanced Placement (AP), 27.06.2019 08:00
Recycled water is best used for a) drinking b) bathing c) lawns d) dishes e) laundry
Answers: 1
You know the right answer?
The following bar graph shows the population of bacteria under different temperature ranges.
What c...
Questions


Spanish, 10.10.2021 15:00


Social Studies, 10.10.2021 15:00


Chemistry, 10.10.2021 15:00

Arts, 10.10.2021 15:00
Mathematics, 10.10.2021 15:00
Mathematics, 10.10.2021 15:00

Biology, 10.10.2021 15:00
Biology, 10.10.2021 15:00


