
Advanced Placement (AP), 15.12.2021 05:00 YOURKINGNESS7689
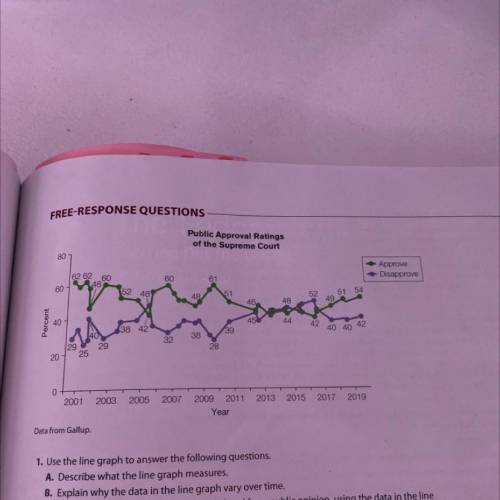
1. Use the line graph to answer the following questions.
A. Describe what the line graph measures.
B. Explain why the data in the line graph vary over time.
C. Explain why the Supreme Court is insulated from public opinion, using the data in the line
graph.
D. Explain how public opinion may impact the Supreme Court.

Answers: 2


Another question on Advanced Placement (AP)
Advanced Placement (AP), 23.06.2019 06:00
Here is a quote from an npr news article: “on average, working-age adults were eating about 78 fewer calories per day in 2010, compared with five years earlier. the new report is based on data from the national health and nutrition examination survey, which collects details on eating habits and other health-related information from a nationally representative sample of about 10,000 people in the u.s.” which of the following is true about the numerical value 78? a. it is an anecdote. b. it is a parameter. c. it is a simulation. d. it is a statistic.
Answers: 1
Advanced Placement (AP), 23.06.2019 13:20
Giving free brainliest + free points if answered correctly ! rural areas have of development. a. heavy signs b. no signs c. one type d. different types
Answers: 2
Advanced Placement (AP), 24.06.2019 12:30
States might choose to cooperate at the regional or global level for all of the following reasons except (2 points) a.) to gain regional political influence b.) to engage in dispute resolution c.) to assure basic human rights d.) to encourage economic interaction e.) to increase national sovereignty
Answers: 3
You know the right answer?
1. Use the line graph to answer the following questions.
A. Describe what the line graph measures....
Questions


Mathematics, 19.12.2019 18:31
Business, 19.12.2019 18:31


