
Biology, 21.11.2019 16:31 litwork5885
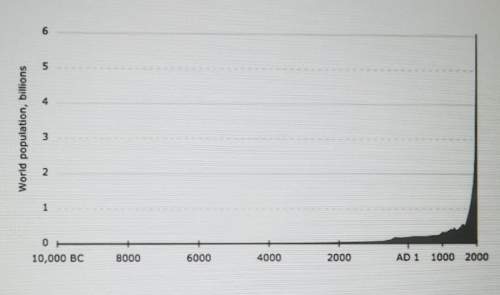
The graph illustrates the growth of human population since 10,000 b. c. which statement is not supported by the data in the graph?
a) human populations have been affected by limiting factors.
b) human population has increased dramatically over the last century.
c) most of the increases in human populations have happened recently.
d) human population growth very slowly over the first 8,000 years of human existence.

Answers: 2


Another question on Biology
Biology, 22.06.2019 02:00
What is the next step in muscle contraction after the actin changes shape? (apex)
Answers: 1
Biology, 22.06.2019 06:00
In "the man in the water," what was the remarkable occurrence that rosenblatt reported?
Answers: 1
Biology, 22.06.2019 06:40
Which term describes a normal value for something in the body? a.homeostasis b.set point c.feedback loop d.integration center
Answers: 1
You know the right answer?
The graph illustrates the growth of human population since 10,000 b. c. which statement is not suppo...
Questions

History, 28.12.2021 05:00
SAT, 28.12.2021 05:00
History, 28.12.2021 05:00


Chemistry, 28.12.2021 05:10

Mathematics, 28.12.2021 05:10

Social Studies, 28.12.2021 05:10
SAT, 28.12.2021 05:10
Mathematics, 28.12.2021 05:10
SAT, 28.12.2021 05:10


