
Biology, 27.11.2019 23:31 trinityine
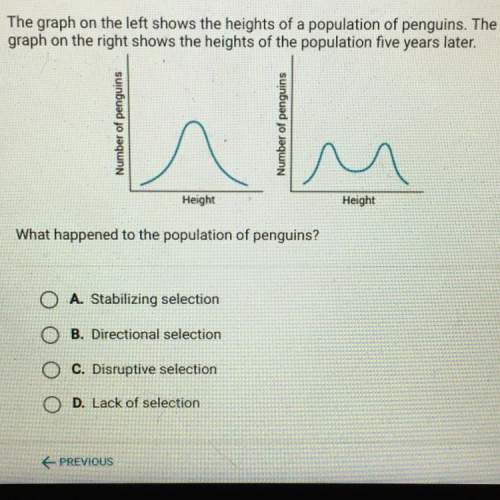
The graph on the left shows the heights of a population of penguins. the graph on the left shows heights of the population five years later.
what happened to the population of penguins?

Answers: 1


Another question on Biology
Biology, 22.06.2019 13:30
What is any method of measuring the age of an object or event in years, such as using atomic half-life?
Answers: 2
Biology, 22.06.2019 17:00
An uncomfortable feeling in the ears when descending in an airplane is caused by changes in air pressure on the: a. inner ear b. middle ear c. eardrum d. hammer/anvil
Answers: 2
You know the right answer?
The graph on the left shows the heights of a population of penguins. the graph on the left shows hei...
Questions

Mathematics, 04.02.2021 01:50

Social Studies, 04.02.2021 01:50

English, 04.02.2021 01:50

English, 04.02.2021 01:50
Mathematics, 04.02.2021 01:50
Mathematics, 04.02.2021 01:50

Biology, 04.02.2021 01:50
Mathematics, 04.02.2021 01:50
Mathematics, 04.02.2021 01:50

Arts, 04.02.2021 01:50

Health, 04.02.2021 01:50
Mathematics, 04.02.2021 01:50


