The graph, below,
illustrates the temperature
changes at willis island in the
cora...

Biology, 28.08.2019 02:10 ob3ymysins
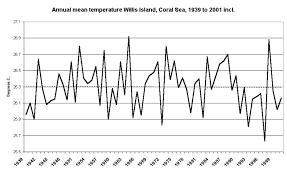
The graph, below,
illustrates the temperature
changes at willis island in the
coral sea from 1939-2001. the
researchers proposed the
hypothesis:
at willis island in the coral sea, coral
bleaching occurred from 1953-1966.
1. discuss whether the data
represented in the graph
supports this hypothesis.
2.outline an experiment that researchers could do to test whether corals on a reef are currently bleaching.
your answer should include reference to the control of variables and the collection of quantitative results.

Answers: 3


Another question on Biology
Biology, 22.06.2019 02:00
Name the two stages involved in protein synthesis and explain what occurs in each of the two stages. be sure to also indicate where each process takes place. plz don't give one sentence answers : d
Answers: 2
Biology, 22.06.2019 13:00
What is the role of dna ligase in the elongation of the lagging strand during dna replication?
Answers: 1
You know the right answer?
Questions


Mathematics, 09.12.2020 18:00


English, 09.12.2020 18:00
Physics, 09.12.2020 18:00
Mathematics, 09.12.2020 18:00

Mathematics, 09.12.2020 18:00


Social Studies, 09.12.2020 18:00
Mathematics, 09.12.2020 18:00


