
Biology, 12.10.2019 02:10 alyssaxsanchez
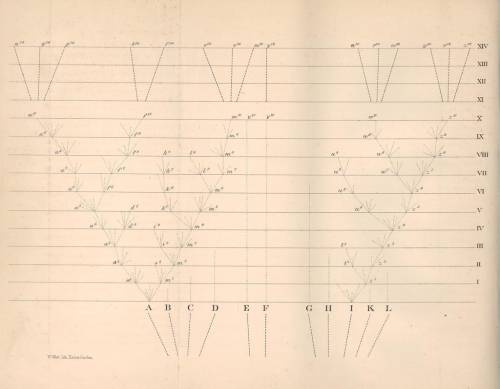
The horizontal axis of the cladogram depicted below is a timeline that extends from 100,000 years ago to the present; the vertical axis represents nothing in particular. the labeled branch points on the tree (v-z) represent various common ancestors. let's say that only since 50,000 years ago has there been enough variation between the lineages depicted here to separate them into distinct species, and only the tips of the lineages on this tree represent distinct species. in darwin's tree of life, each fork in the tree represents
a. morphologic gaps in the fossil record
b. groups of living organisms
c. groups of extinct organisms
d. the most recent common ancestor of the subsequent branches

Answers: 2


Another question on Biology
Biology, 22.06.2019 02:30
The theories on the expansion of galaxies maybe re-examined to strengthen science should not be tested to strengthen science will weaken scientific knowledge if they change will become laws if they don't change
Answers: 1
Biology, 22.06.2019 06:50
How many chromosomes does each human cell contain? a. 23 chromosomes b. 26 chromosomes c. 43 chromosomes d. 46 chromosomes
Answers: 2
Biology, 22.06.2019 12:30
In meiosis ii during anaphase ii which structures separated homologous chromosomes or sister chromatids
Answers: 1
You know the right answer?
The horizontal axis of the cladogram depicted below is a timeline that extends from 100,000 years ag...
Questions


Chemistry, 04.08.2021 22:20
English, 04.08.2021 22:20
Mathematics, 04.08.2021 22:20

Law, 04.08.2021 22:20
Mathematics, 04.08.2021 22:20


