
Biology, 25.10.2019 02:43 goodperson21
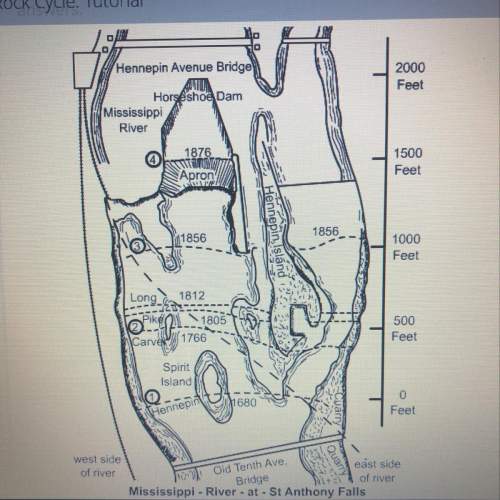
The map shows a top view of the mississippi river. the gap between lines 1 and 2 shows how much saint anthony
falls receded between 1680 and 1766. the gap between lines 3 and 4 shows how much the falls receded between
1856 and 1876. at what rate (on average) did the falls recede during each of these time spans? express your answer
in units of feet per year. did the rate increase or decrease from one time span to the next?
hint: determine how many years passed between lines 1 and 2 and between lines 3 and 4 to you find your
answers,

Answers: 2


Another question on Biology
Biology, 21.06.2019 18:50
Of the pollutants that form acids in the atmosphere, which is easiest to reduce? a. sulfur dioxide b. nitrogen dioxide c. ozone d. carbon monoxide
Answers: 3
Biology, 22.06.2019 08:30
Which member of the following food chain will be least affected by ddt, a pesticide water pollutant, if bio-magnification is occurring? algae> zooplankton> crayfish> leopard frog> large mouth bass
Answers: 3
Biology, 22.06.2019 09:50
Tropical rain forests support more species per unit area than any other terrestrial ecosystem. what is one way rain forests are important to the health of the biosphere?
Answers: 1
Biology, 22.06.2019 12:00
Which are evidence of seafloor spreading? check all that apply. molten material magnetic stripes continent material drilled core samples ocean water samples
Answers: 1
You know the right answer?
The map shows a top view of the mississippi river. the gap between lines 1 and 2 shows how much sain...
Questions


Mathematics, 18.03.2020 01:17
Biology, 18.03.2020 01:17

Mathematics, 18.03.2020 01:17
History, 18.03.2020 01:17
Mathematics, 18.03.2020 01:17

English, 18.03.2020 01:17

Mathematics, 18.03.2020 01:18

Law, 18.03.2020 01:18

Mathematics, 18.03.2020 01:18

Mathematics, 18.03.2020 01:18


