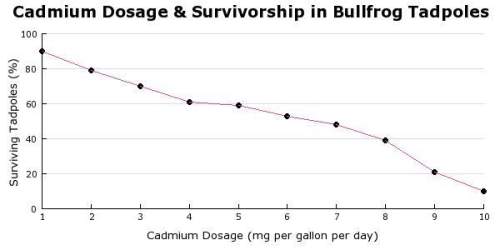
Based on the graph, the independent variable is
a) cadmium dosage.
b) tadpole populatio...


Answers: 1


Another question on Biology
Biology, 21.06.2019 17:00
The construction of phylogenetic trees is a mapping out the proposed divisions and common ancestors of all living species. traditionally, these trees have been built using morphological data, such as appearance and embryology. recently, it has been possible to construct these trees using molecular data. phylogenetic trees based on different types of information agree with each: that there is strong evidence of a real underlying common descent. this phylogenic tree is composed based on molecular data (rrna). what statements can we infer are true about the organisms throughout the tree? because the tree is rooted, all branches share a common ancestor. all organisms have some sort of cellular structure/organization. all eukaryotes evolved from bacteria. since the organisms contain rna, they share the same dna. if the organisms contain rna, the share the same four nitrogen bases.
Answers: 1
Biology, 22.06.2019 02:00
Which of the following is not a food produced in rainforests? a) coffee b) cocoa c) avocados d) wheat
Answers: 2
Biology, 22.06.2019 04:00
What is the difference between how ionic and covalent bonds form
Answers: 1
Biology, 22.06.2019 05:30
This map shows how climate change might affect precipitation patterns in the great plains of the united states by the end of this century. brown shoes a decrease in percipitation, and blue shows an increase. the maps differ based on the predictive levels of green house emissions. the maps shows that northern area should get a. more pracipations regardless of emmissions b. less pracipation, regardless of emmissions levels c. more precipitation, but only when emission levels.southern areas show a. more pracipations regardless of emmissions b. less pracipation, regardless of emmissions levels c. more precipitation, but only when emission levels.to use these maps to prepare for natural disasters in the great plains, scientist need to ask? a. how many tons of emissions were used at the basis of the map.b. which types of fossil fuels are used in the great plains c. if you think the above is wrong it's probly c the question is cut off
Answers: 1
You know the right answer?
Questions


Engineering, 02.04.2021 19:00
Mathematics, 02.04.2021 19:00


History, 02.04.2021 19:00
Biology, 02.04.2021 19:00
Mathematics, 02.04.2021 19:00
Mathematics, 02.04.2021 19:00
Mathematics, 02.04.2021 19:00
Mathematics, 02.04.2021 19:00

Chemistry, 02.04.2021 19:00
Mathematics, 02.04.2021 19:00

Mathematics, 02.04.2021 19:00


