What can be interpreted from the graph?
a)number of microbes reduces with the time.
b)n...

Biology, 24.01.2020 21:31 PrincessKeliah8179
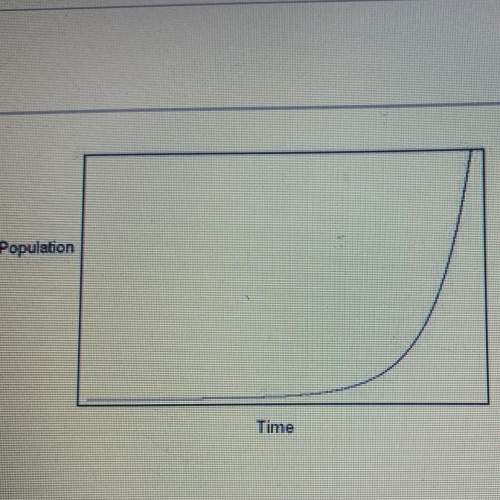
What can be interpreted from the graph?
a)number of microbes reduces with the time.
b)number of microbes remains constant with time.
c)number of microbes increases at a constant rate.
d)number of microbes increases exponentially with time.

Answers: 2


Another question on Biology
Biology, 21.06.2019 19:00
What are the four basic classes of organic molecules how do they differ structurally and functionally
Answers: 1
Biology, 21.06.2019 23:30
Examine the two squirrel populations in the accompanying figure. the populations are separated by a geographic barrier. if after a long period of time the two species are no longer separated, what evidence is needed to determine if speciation has occurred? the figure shows two populations of squirrels separated by a geographic barrier. examine the two squirrel populations in the accompanying figure. the populations are separated by a geographic barrier. if after a long period of time the two species are no longer separated, what evidence is needed to determine if speciation has occurred? the figure shows two populations of squirrels separated by a geographic barrier. polyploidy is creating new species. the two populations are not interbreeding freely. hybrid offspring of the two populations begin to appear. one species will increase into a population size twice as large as the other species.
Answers: 2
Biology, 22.06.2019 12:10
26 a medida que cambia el clima, ¿qué tipo de reproducción más probablemente de a una especie mayores posibilidades de supervivencia?
Answers: 2
You know the right answer?
Questions


Business, 04.09.2019 19:30
Social Studies, 04.09.2019 19:30


Biology, 04.09.2019 19:30


