
Biology, 05.03.2020 20:22 gwendallinesikes
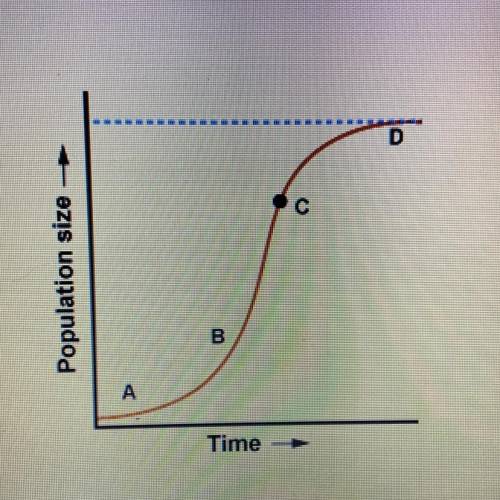
This graph shows a population of mice in an ecosystem in which mice are not allowed to enter or leave.
Which statement best describes the population at point C?
A.) it’s death rate is higher than its birthdate.
B.) it is at it’s carrying capacity.
C.) it is decreasing in size.
D.) it’s growing rate is slowing down.

Answers: 1


Another question on Biology
Biology, 21.06.2019 21:00
The pattern of this wave changes between its beginning and end. what is true about the amplitude and wavelength of the wave when the pattern changes?
Answers: 3
Biology, 22.06.2019 02:00
The phylogenetic tree illustrates the relationship between humans and our closest living relatives. the tree was based on biochemical comparisons, including dna and amino acid sequences. according to the biomolecular data, we could infer that
Answers: 1
Biology, 22.06.2019 02:10
Scenario #2 in 2001, a population of 2,500 poison dart frogs lived in the amazon rain forest. due to increased deforestation, the population dwindled to 25 frogs in 2019. new government regulations were enacted in 2022, successfully putting an end to the deforestation of the amazon rain forest. once deforestation was stopped, the poison dart frog population was able to recover. by 2050, the population reached 8,000 frogs, of that population, 20 are homozygous recessive for being spotted (ss genotype). q2- ? q- p- p2- 2pq-
Answers: 2
Biology, 22.06.2019 04:00
Indicate the coat color and the proportion of offspring with that color for each of the following crosses of rabbits. assume all are homozygous. agouti x albino a) 1/2 albino, 1/2 agouti b) all agouti c) 3/4 agouti, 1/4 albino
Answers: 2
You know the right answer?
This graph shows a population of mice in an ecosystem in which mice are not allowed to enter or leav...
Questions

History, 22.04.2020 03:57

Computers and Technology, 22.04.2020 03:57


History, 22.04.2020 03:57

Biology, 22.04.2020 03:57


