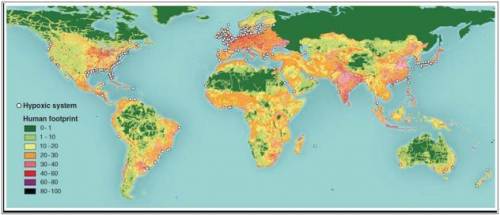
1) What type of graph is shown in the image above?
2) How are dead zones represented on...

Biology, 06.05.2020 00:00 hannahelisabeth19
1) What type of graph is shown in the image above?
2) How are dead zones represented on the graph?
3) How is the human footprint or degree of human influence represented on the graph?

Answers: 2


Another question on Biology
Biology, 21.06.2019 20:00
Aresearcher has developed two stains for use with seed plants. one stains sporophyte tissue blue; the other stains gametophyte tissue red. if the researcher exposes pollen grains to both stains, and then rinses away the excess stain, what should occur? a) the pollen grains will be pure red.b) the pollen grains will be pure blue.c) the pollen grains will have red interiors and blue exteriors.d) the pollen grains will have blue interiors and red exteriors.
Answers: 1
Biology, 21.06.2019 23:10
Blood has traveled from the heart to the toes. which describes the next step of the circulation process?
Answers: 1
Biology, 22.06.2019 03:30
Matthew decided he wanted to hike up mount everest. on his way to the top, it began to snow and the temperature dropped to -10°f. matthew forgot to wear a heavy jacket so his body began to shiver beyond control. in this case, matthew's body shivering is the to a drop in temperature. * 0 points reflex stimuli responce environmental facto
Answers: 1
Biology, 22.06.2019 07:40
What's the waste product of electrons and pyruvate combining in fermentation?
Answers: 2
You know the right answer?
Questions


English, 02.09.2020 18:01


Mathematics, 02.09.2020 18:01


