
Biology, 05.05.2020 18:12 jaemitchell23
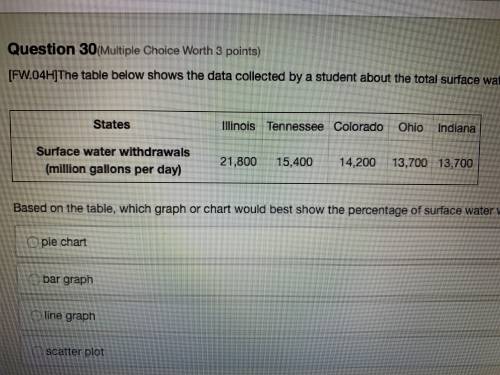
The table below shows the data collected by a student about the total surface water withdrawn from five different states in the year 2000. Based on the table, which graph or chart would best show the percentage of surface water withdrawal by the five states? (not biology i didn’t know what else to choose)

Answers: 2


Another question on Biology
Biology, 22.06.2019 03:40
Imagine you are introducing the lac operan and the trp operon to students who have never learned about it before. complete the table to compare the similarities and differences between the two operons
Answers: 3
Biology, 22.06.2019 09:00
The picture shows a location in india that is very dry and arid. notice the tall mountains in the background; you can find high amounts of vegetation on the other side of the mountains. which statement is most likely true for this area?
Answers: 1
Biology, 22.06.2019 10:00
1. fold your hands together so your thumbs cross over ,and look at your thumbs. which thumb feels most "comfortable" on top is actually controlled by a gene. the left thumb folding over the right thumb is a domi
Answers: 3
You know the right answer?
The table below shows the data collected by a student about the total surface water withdrawn from f...
Questions

Mathematics, 17.04.2021 03:10
Mathematics, 17.04.2021 03:10

Physics, 17.04.2021 03:10

History, 17.04.2021 03:10

Mathematics, 17.04.2021 03:10
Mathematics, 17.04.2021 03:10
Mathematics, 17.04.2021 03:10

Arts, 17.04.2021 03:10
SAT, 17.04.2021 03:10


