
Biology, 06.05.2020 22:15 Dragonskeld
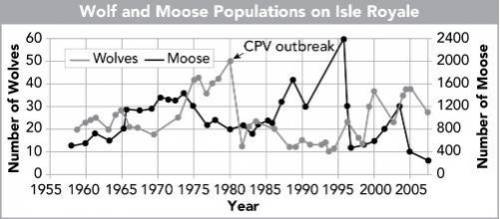
On Isle Royale, wolves are the main predators of moose. The graph shows the changing wolf and moose populations on the island over a 50-year time span.
The graph plots the populations of moose and wolves in separate lines from 1955 to 2005. The two populations appear to follow opposite trends: when one population is higher, the other population is lower.
Which statement provides the strongest explanation for the trends in the two populations?
A. The populations of predators and prey are limited by abiotic factors only.
B. Predation acts a density-dependent limiting factor on prey, but not on predators.
C. Predation acts as a density-independent limiting factor on predators, but not on prey.
D. Predator-prey relationships act as density-dependent limiting factors on both predators and prey.

Answers: 2


Another question on Biology
Biology, 22.06.2019 11:00
3what is the range of the function shownin the graph? ucation solutionsnw novo-9-8-7 -6 -5 -4 -3 -2 -1123456789
Answers: 1
Biology, 22.06.2019 12:00
Why does the earth spin slowly, not faster? is it possible to prove it scientifically? can you prove it with math?
Answers: 2
Biology, 22.06.2019 13:30
When the solution concentration on the outside of a cell is greater than thesolution concentrate on the inside of the cell, what type of solution is the cellwithin?
Answers: 1
Biology, 22.06.2019 13:30
What is used as a template during replication? a- mrna b- trna c- rrna d- dna
Answers: 1
You know the right answer?
On Isle Royale, wolves are the main predators of moose. The graph shows the changing wolf and moose...
Questions

Computers and Technology, 16.02.2022 14:00


World Languages, 16.02.2022 14:00


Mathematics, 16.02.2022 14:00
History, 16.02.2022 14:00


