
Biology, 22.05.2020 18:01 blairjaneaoyrfvp
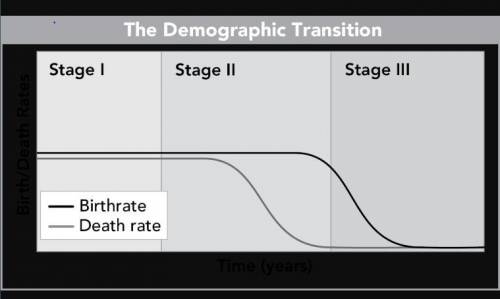
59. Demographers use graphs like this one to analyze patterns of population growth and decline.
The graph plots birthrate and death rate over time, in years. In Stage I, both rates begin relatively high. In Stage II, birth rate remains high while death rate decreases. At the end of Stage II and into Stage III, birthrate decreases to match the low death rate.
Suzie studies the graph and concludes that in Stage I and at the end of Stage III, the population of a country either is not changing size or is increasing slightly. Which assumption is necessary for Suzie’s conclusion to be accurate?
A. The population of the country did not increase substantially during Stage II.
B. The population of the country increased at least slightly during Stage II.
C. The population has a roughly equal distribution of people in age groups from ages 0 to 60 years.
D. The difference between the rates of immigration and emigration is insignificantly small.

Answers: 2


Another question on Biology
Biology, 21.06.2019 23:00
Adoctor is trying to diagnose a patient with dry skin. which of the following resources would be the most ? a magazine ad about soft skin a growth chart online articles about dry skin medical books
Answers: 2
Biology, 22.06.2019 06:00
Why does bubbling occur when vinegar mixed with baking soda
Answers: 1
Biology, 22.06.2019 08:50
What does the positioning of transcription factors determine?
Answers: 1
You know the right answer?
59. Demographers use graphs like this one to analyze patterns of population growth and decline.
Questions


Computers and Technology, 20.12.2019 22:31


