
Biology, 24.05.2020 00:04 germainenez3288
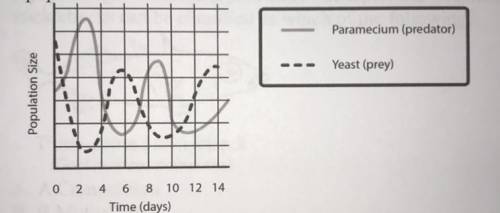
The graph provided presents information on changes in the populations of a predator and its prey over time. Which of the following best explains the increases and decreases in the predator population?
A. A There were variations in the food supply.
B. B Predators migrate frequently.
C. C The paramecium competed with the yeast.
D. D Populations always achieve a stable level.

Answers: 2


Another question on Biology
Biology, 22.06.2019 02:30
Acertain species of fish can have either long or short fins. the allele for long fins is dominant over the allele for short fins. a heterozygous, long-finned fish is crossed with a homozygous, short-finned fish. of the offspring, will have long fins and be , and will have short fins and be .
Answers: 2
Biology, 22.06.2019 04:30
Individuals do not compete directly for resources, but are prey for the same predator
Answers: 1
Biology, 22.06.2019 08:00
Why did mendel use pea plants in his experiments? a. they have no alleles. b. they are haploid organisms. c. they reproduce quickly. d. they are all male.
Answers: 1
You know the right answer?
The graph provided presents information on changes in the populations of a predator and its prey ove...
Questions


Chemistry, 25.02.2020 20:17

Mathematics, 25.02.2020 20:17


Mathematics, 25.02.2020 20:17
English, 25.02.2020 20:17

Health, 25.02.2020 20:17


