
Biology, 25.05.2020 00:00 ErnieIrwin
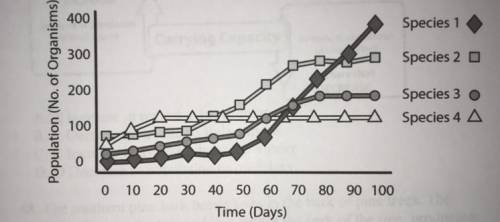
The graph provided shows the change in size of four populations introduced into a new habitat. Which population was the first to reach the limit of the capacity of this habitat to support it?
A. Species 1
B. Species 2
C. Species 3
D. Species 4

Answers: 3


Another question on Biology
Biology, 21.06.2019 14:30
As soon as possible this assignment is due in 5 minutes atoms in a molecule are bonded together by sharing, gaining, or a. photons b. protons c. neutrons d. energy f. electrons
Answers: 1
Biology, 22.06.2019 03:50
2. how does the miller-urey experiment fall short of demonstrating that life can arise from inorganic molecules? explain. a. it doesn't show a leap between a collection of amino acids and a single-celled organism. b. it recreates the conditions that existed at the earth's beginning, but no molecules form as a result. c. it doesn't provide evidence of the formation of amino acids. d. it doesn't show how multicellular organisms developed from unicellular organisms
Answers: 2
Biology, 22.06.2019 13:30
During the process of blank and molecules such as a glucose must use a protein channel to cross through a cell membrane
Answers: 1
You know the right answer?
The graph provided shows the change in size of four populations introduced into a new habitat. Which...
Questions

Computers and Technology, 17.06.2021 19:50

Mathematics, 17.06.2021 19:50

History, 17.06.2021 19:50

Mathematics, 17.06.2021 19:50
Mathematics, 17.06.2021 19:50

Mathematics, 17.06.2021 19:50
Mathematics, 17.06.2021 19:50
Mathematics, 17.06.2021 19:50

Physics, 17.06.2021 19:50


