
Biology, 26.05.2020 20:02 Heyitsbrandi
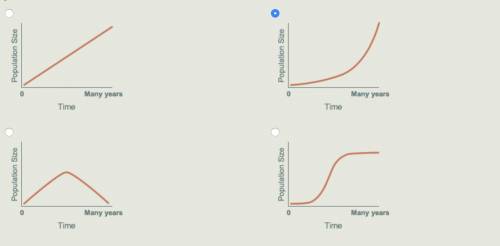
Which graph represent approximately how might you expect the salamander population to change over very many years?

Answers: 1


Another question on Biology
Biology, 22.06.2019 00:10
Recent research by marine biologists suggests that bottlenose dolphins have names for themselves. scientists played sounds they had identified as the names of particular dolphins, putting them through a synthesizer so that they did not sound like the voices of particular dolphins. the researchers found that dolphins would respond to the names of other dolphins that they were related to or associated with, but they ignored the names of strangers. this discovery suggests a much greater degree of self-awareness in aquatic mammals than was previously suspected. if this research holds up, what does it suggest about dolphins?
Answers: 3
Biology, 22.06.2019 04:00
What sentence best supports the statement that hormones are involved in the regulation of homeostasis? a. the hormone erythropoeitin increases the production of red blood cells when oxygen levels are low. b. the hormone oxytocin promotes labor contractions of the uterus during childbirth. c. the hormone melatonin induces sleep and its production is slowed by exposure to light. d. the hormone cortisol suppresses the immune system and is produced when the body is under stress.
Answers: 3
Biology, 22.06.2019 04:30
Individuals do not compete directly for resources, but are prey for the same predator
Answers: 1
Biology, 22.06.2019 16:40
Introducing minvasive species to an ecosystem results in an increase in biodiversity is it true or false
Answers: 1
You know the right answer?
Which graph represent approximately how might you expect the salamander population to change over ve...
Questions


English, 22.07.2019 05:00


Health, 22.07.2019 05:00
Biology, 22.07.2019 05:00
History, 22.07.2019 05:00


Physics, 22.07.2019 05:00
Mathematics, 22.07.2019 05:00


