
Biology, 20.06.2020 00:57 MalikaJones
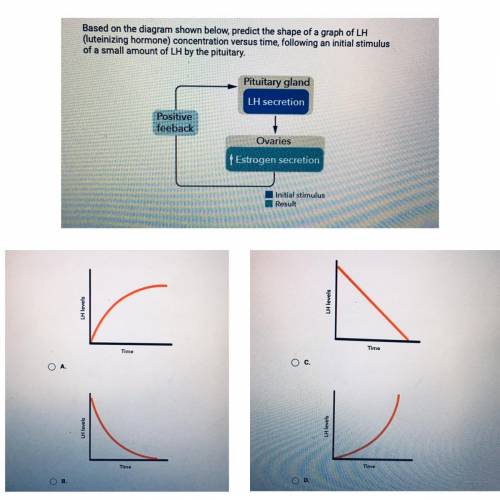
Based on the diagram shown below, predict the shape of a graph of LH (luteinizing hormone) concentration versus time, following an initial stimulus of a small amount of LH by the pituitary.

Answers: 1


Another question on Biology
Biology, 21.06.2019 18:30
Asap timed! 1. ice core samples from glaciers ice caps contain bubbles of ancient atmosphere that are in layers based on age. what questions are scientists most interested in? a. how the amount of water vapor needed to make the ice has changed b. how the amount of ozone has changed over time.c. how the amount of ice in each layer has changed over time d. how the amount of carbon dioxide has changed over time 2. what produces milankovich cycles ? a. sunspots ams solar flare on the suns surface b. changes in the earths orbit c. gravitational changes bases on the position of the sun and the moond. cycles of vegetation that result in desert and rainforest conditions
Answers: 1
Biology, 22.06.2019 10:00
Which statement is true for bacteria a. bacteria have complex internal structures b. all bacteria are spiral in shape c. all bacteria cause disease in animals d. bacteria break down some foods
Answers: 1
Biology, 22.06.2019 11:20
2polnis which of the following is an advantage of an in vitro experiment?me
Answers: 1
Biology, 22.06.2019 13:30
Methane gas created by a cows flatulence especially in a large herd is a greenhouse gas. true or false.
Answers: 2
You know the right answer?
Based on the diagram shown below, predict the shape of a graph of LH (luteinizing hormone) concentra...
Questions


Computers and Technology, 14.02.2020 20:18


Mathematics, 14.02.2020 20:19

English, 14.02.2020 20:19
Mathematics, 14.02.2020 20:19
Mathematics, 14.02.2020 20:20
Mathematics, 14.02.2020 20:20


