
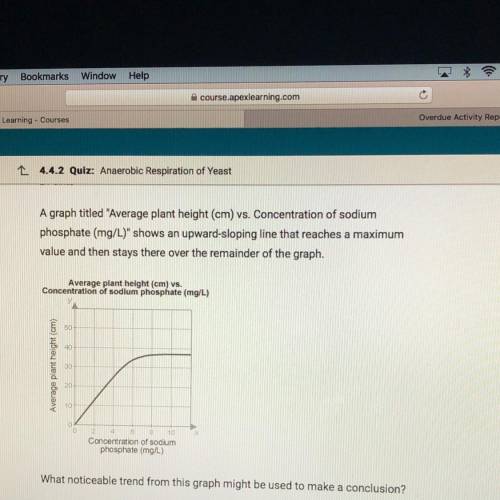
A graph titled "Average plant height (cm) vs. Concentration of sodium
phosphate (mg/L)" shows an upward-sloping line that reaches a maximum
value and then stays there over the remainder of the graph.
Average plant height (cm) vs.
Concentration of sodium phosphate (mg/L)
Average plant height (cm)
30 20 10 Concentration of sodium
phosphate (mg/l)
What noticeable trend from this graph might be used to make a conclusion?
A. Average plant height is not affected by the concentration of
sodium phosphate.
B. Average plant height increases with an increase in the
concentration of sodium phosphate until the plants reach a
maximum possible height
C. Average plant height causes an increase in the concentration of
sodium phosphate
D. Average plant height is halved every time the concentration of
sodium phosphate is doubled until all of the sodium phosphate
has been used up

Answers: 3


Another question on Biology
Biology, 21.06.2019 22:00
Explain why phospholipid molecules form a bilayer. (3 marks)
Answers: 1
Biology, 22.06.2019 01:30
All individuals have two alleles for a given trait. according to mendel's these alleles are passed down one each from both mother and father.
Answers: 1
Biology, 22.06.2019 05:20
The mammal pictured below is a silvery mole rat. which statement is an inference based on the picture? the animal is ugly. the animal has hairless feet with sharp claws. the animal has prominent upper and lower incisor teeth. the animal likely has poor vision since its eyes are so small.
Answers: 2
You know the right answer?
A graph titled "Average plant height (cm) vs. Concentration of sodium
phosphate (mg/L)" shows an up...
Questions


Mathematics, 20.02.2022 09:20

Computers and Technology, 20.02.2022 09:20


English, 20.02.2022 09:20

Law, 20.02.2022 09:20

Mathematics, 20.02.2022 09:20


Physics, 20.02.2022 09:30
Mathematics, 20.02.2022 09:30

Health, 20.02.2022 09:30
Business, 20.02.2022 09:30


