
Biology, 20.09.2020 19:01 TheGaines4life
Select the correct location on the graph.
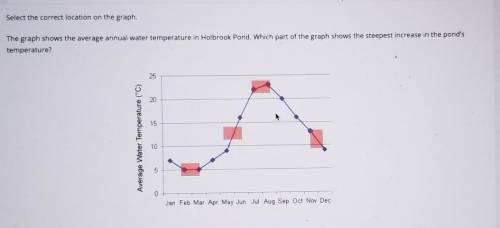
The graph shows the average annual water temperature in Holbrook Pond. Which part of the graph shows the steepest increase in the pond's
temperature?
25
20
15
Average Water Temperature (°C)
10
5
0
Jan Feb Mar Apr May Jun Jul Aug Sep Oct Nov Dec

Answers: 2


Another question on Biology
Biology, 21.06.2019 19:30
Astudent observes a star from two positions of earth in its orbit, in summer and winter, and measures the change in the position of the star. which of these can be best calculated by this method?
Answers: 1
Biology, 22.06.2019 00:40
There is a liquid capsule inside a cup full of liquid. the cup full of liquid has salt in it and the liquid capsule has no salt in it. in which direction will the solvent flow? a. the salt does not have to move b. from the capsule to the larger cup c. equally between the capsule and the cup d. from the larger cup to the capsule
Answers: 1
You know the right answer?
Select the correct location on the graph.
The graph shows the average annual water temperature in H...
Questions


Mathematics, 25.04.2020 00:50


Mathematics, 25.04.2020 00:50


History, 25.04.2020 00:50
Mathematics, 25.04.2020 00:50

Computers and Technology, 25.04.2020 00:50


