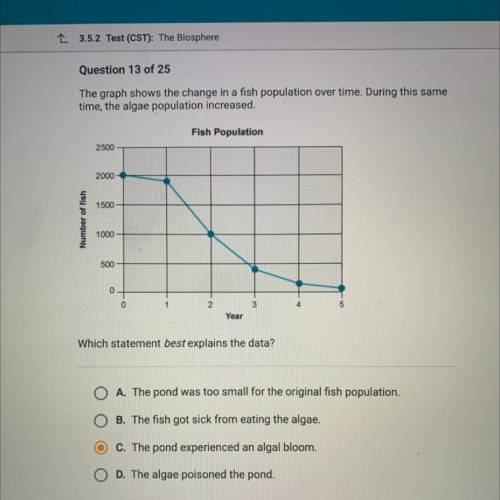
Question 13 of 25
The graph shows the change in a fish population over time. During this same
...

Question 13 of 25
The graph shows the change in a fish population over time. During this same
time, the algae population increased.
Which statement best explains the data?
O A. The pond was too small for the original fish population.
O B. The fish got sick from eating the algae.
O C. The pond experienced an aiyal bloom.
O D. The algae poisoned the pond.


Answers: 2


Another question on Biology

Biology, 22.06.2019 02:30
Did you know that a single bee would have to go to over 2 million flowers to make a single pound of honey?
Answers: 1

Biology, 22.06.2019 12:00
Label the steps for protein synthesis in order, beginning with the first steponce the protein is made, the gene for a particular trait is expressedmrna joins the ribosome, and the anticodons from trna join mrna to form a chain ofamino acidsrna polymerase unzips dna and free rna nucleotides join dna to form mrnav a chain of amino acids is formed from peptide bonds, creating a proteinmrna is transported from the nucleus of the cell to the ribosomes of the cell.
Answers: 1

Biology, 22.06.2019 16:00
Which of the following would involve looking at different structures of organisms and comparing how similar they are? a. vestigial structuresb. radiometric datingc. homologous structures
Answers: 1

Biology, 22.06.2019 17:00
What would be he the strand of complementary dna produced be the strand of dna shown below> tcg aag
Answers: 1
You know the right answer?
Questions


Health, 30.11.2021 01:00


Mathematics, 30.11.2021 01:00


English, 30.11.2021 01:00

Mathematics, 30.11.2021 01:00

Mathematics, 30.11.2021 01:00

Mathematics, 30.11.2021 01:00

Chemistry, 30.11.2021 01:00

Mathematics, 30.11.2021 01:00

Biology, 30.11.2021 01:00

Mathematics, 30.11.2021 01:00

Mathematics, 30.11.2021 01:00

English, 30.11.2021 01:00

Mathematics, 30.11.2021 01:00

Mathematics, 30.11.2021 01:00


