
Biology, 28.11.2020 04:10 kehrieheb9526
Activity Instructions
Analyze the data presented in the graph and table below. Then write a summary addressing the following:
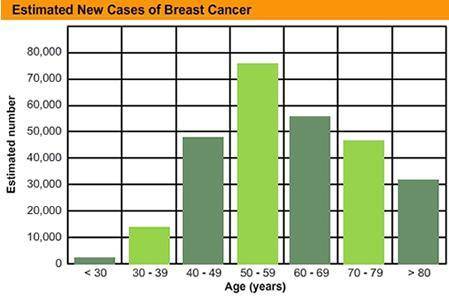
1. The histogram below shows the total estimated new breast cancer cases diagnosed in 2003. (first image)
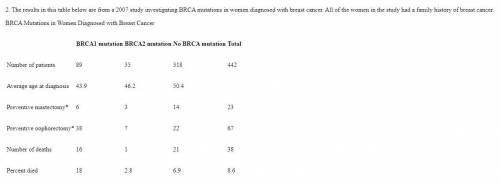
2. The results in this table below are from a 2007 study investigating BRCA mutations in women diagnosed with breast cancer. All of the women in the study had a family history of breast cancer. (second image)
*A mastectomy is the surgical removal of one or both breasts, either partially or fully. An oophorectomy is the surgical removal of an ovary or ovaries.
Things to address in your summary essay:
-Describe how mutations lead to genetic variations.
-Which appears to be more dangerous: the BRC1 or BRC2 mutation?
-Analyze a woman’s risk of dying of cancer if she carries a mutated BRC1 gene.
-How do heredity and inheritance relate to the data presented in these charts?
-What data would you need to see in order to draw conclusions about the effectiveness of preventive surgeries?
-What does the age at diagnosis tell you about the mutation?
-Explain how breast-cancer genes are still present in the population, despite cancer-related surgeries and deaths.

Answers: 1


Another question on Biology
Biology, 21.06.2019 14:50
Previous pagenext pagepage 3 ofquestion 3 (1 point)which of the following consist of cells that do not have a nucleus? of the above
Answers: 2
Biology, 22.06.2019 04:30
Why are scientists concerned about the depletion of the ozone levels in the stratosphere?
Answers: 2
Biology, 22.06.2019 07:00
What terms describes being out of water after being submerged
Answers: 1
Biology, 22.06.2019 07:00
What was the purpose of mendel's experiments with dihybrid crosses? a. to determine if dna was a transforming factor b. to determine if traits could be recessive c. to determine if traits affected each other d. to determine if traits had more than one allele
Answers: 3
You know the right answer?
Activity Instructions
Analyze the data presented in the graph and table below. Then write a summary...
Questions


Mathematics, 13.05.2021 21:10


Chemistry, 13.05.2021 21:10
Mathematics, 13.05.2021 21:10
Mathematics, 13.05.2021 21:10
Mathematics, 13.05.2021 21:10

Computers and Technology, 13.05.2021 21:10
Mathematics, 13.05.2021 21:10
Mathematics, 13.05.2021 21:10


