
Biology, 02.12.2020 21:30 jessiegarrison1
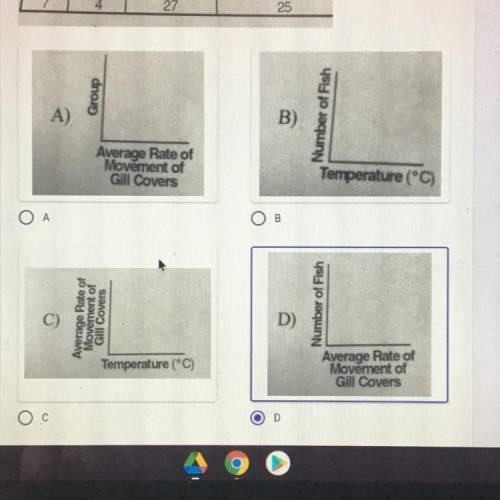
In an investigation, students determined the average rate of movement of
gill covers of a species of freshwater fish at different temperatures. The
results are shown in the data table below. Which labeled axes should be
used to graph the relationship between the two variables? *
DATA TABLE
Average Rate
Number Temperature of Movement of Gill
Groupſ of Fish (°C) Covers per Minute
1 5
10
15
2. 6
15
3 4
18
4 7
20
5
6
23
60
6
4
25
57
7 4
27
25
(81818|க

Answers: 2


Another question on Biology
Biology, 21.06.2019 16:00
Which taxon group is more specific, in regards to organisms that are in that group? mammalia animalia
Answers: 3
Biology, 21.06.2019 23:30
What are some possible short and long term medical concerns for crew members on longer space exploration trips
Answers: 3
Biology, 22.06.2019 05:20
Which of the following two events occur to create a sea breeze? select all that apply. warm air rises on the ocean and moves toward the land to cool warm air rises on land and moves toward the ocean to cool cool air moves from the ocean to be warmed by the land cool air moves from the land to be warmed by the ocean
Answers: 2
You know the right answer?
In an investigation, students determined the average rate of movement of
gill covers of a species o...
Questions

Mathematics, 23.04.2021 18:50
Mathematics, 23.04.2021 18:50
Mathematics, 23.04.2021 18:50

Social Studies, 23.04.2021 18:50

Mathematics, 23.04.2021 18:50

Physics, 23.04.2021 18:50

History, 23.04.2021 18:50
Mathematics, 23.04.2021 18:50


