Biology, 03.12.2020 16:50 eddsworldfrantic
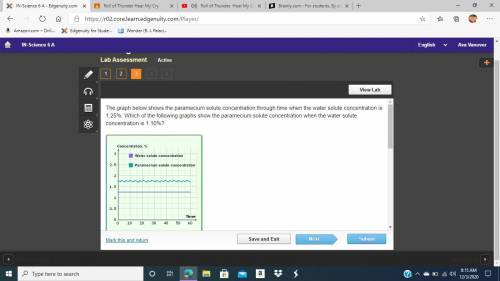
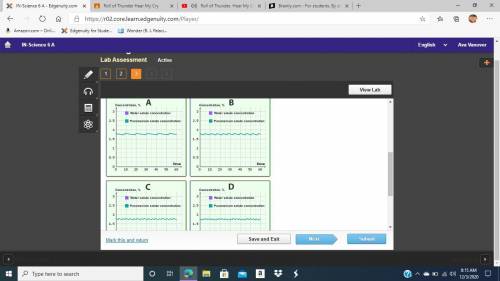
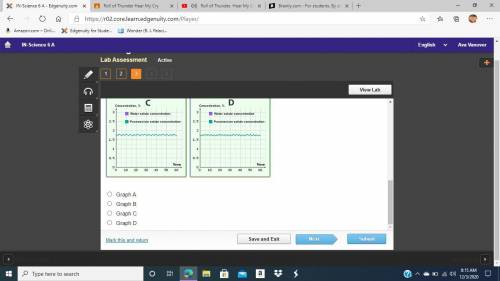
HURRY PLEASE. The graph below shows the paramecium solute concentration through time when the water solute concentration is 1.25%. Which of the following graphs show the paramecium solute concentration when the water solute concentration is 1.10%? Graph A Graph B Graph C Graph D


Answers: 2


Another question on Biology

Biology, 21.06.2019 20:00
Here's one way to follow the scientific method. place the missing steps in the correct position in the process.
Answers: 3

Biology, 22.06.2019 06:30
Is there any solid scientific evidence that humans have been cloned?
Answers: 1

Biology, 22.06.2019 08:00
Which set of terms best describes a community of miners who live out in the countryside of west virginia and use specialized geological equipment to analyze the composition of rock?
Answers: 1

Biology, 22.06.2019 08:10
Match the functions to the cell types ? contraction and relaxation. conducting electrochemical signals fighting diseases carrying genetic material
Answers: 1
You know the right answer?
HURRY PLEASE. The graph below shows the paramecium solute concentration through time when the water...
Questions


Computers and Technology, 31.10.2019 04:31


Computers and Technology, 31.10.2019 04:31

Health, 31.10.2019 04:31


Mathematics, 31.10.2019 04:31


Computers and Technology, 31.10.2019 04:31


