
Biology, 11.12.2020 01:40 augestfaith
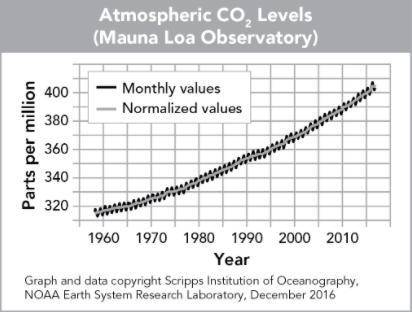
The graph shows the atmospheric levels of carbon dioxide.
The Y-axis is atmospheric carbon dioxide levels in parts per million and runs from 310 to 410. The x-axis is marked in 10-year increments from 1960 to 2010. A zigzag line shows the monthly values. A high point is about 80 parts per million greater than the adjacent low points. There are 10 high points and 10 low points per 10 –year period. A straight line through the center of the zigzag line shows normalized values. In 1958, the level of atmospheric carbon dioxide was about 315 parts per million. In 2016, it was about 415 parts per million.
How have human activities contributed to the trend in the data shown in the graph?
A. Atmospheric carbon dioxide levels have remained steady because natural processes have balanced out human activities.
B. Atmospheric carbon dioxide levels have increased because the increasing human population exhales a greater volume of carbon dioxide.
C. Atmospheric carbon dioxide levels have increased because the burning of fossil fuels releases heat, which causes carbon dioxide to evaporate.
D. Atmospheric carbon dioxide levels have increased because the burning of fossil fuels releases carbon that otherwise would remain in the geosphere.

Answers: 1


Another question on Biology
Biology, 22.06.2019 00:40
3points hurry! what is the relationship between biotechnology, sharkskin, and disease resistance? bioengineers have developed an artificial sharkskin that does not allow resistant bacteria to grow on it. disease-causing microbes have been genetically modified to keep them from infecting the skins of sharks. scientists have created a device that can be attached to the skins of sharks that dramatically increases their abilities to resist disease. sharkskin produces many chemicals that can be collected and used to create antibiotics.
Answers: 1
Biology, 22.06.2019 13:20
Imagine a self-reactive t cell that has not undergone clonal deletion in the thymus (that is to say, it has escaped central tolerance). if it encounters self antigen in the absence of an infection or inflammation, what will happen to this self-reactive t cell? (select two answers) (a) the t cell undergoes clonal expansion. (b) the t cell gains effector functions. (c) the t cell undergoes apoptosis. (d) the t cell becomes activated. (e) the t cell becomes anergic.
Answers: 1
You know the right answer?
The graph shows the atmospheric levels of carbon dioxide.
The Y-axis is atmospheric carbon dioxide...
Questions


History, 14.05.2021 06:10

Chemistry, 14.05.2021 06:10
Mathematics, 14.05.2021 06:10
Mathematics, 14.05.2021 06:10

Mathematics, 14.05.2021 06:10

Computers and Technology, 14.05.2021 06:10

Social Studies, 14.05.2021 06:10
Mathematics, 14.05.2021 06:10
Chemistry, 14.05.2021 06:10
Mathematics, 14.05.2021 06:10
Mathematics, 14.05.2021 06:10
History, 14.05.2021 06:10

History, 14.05.2021 06:10


