
Biology, 12.12.2020 16:20 presleyann1902
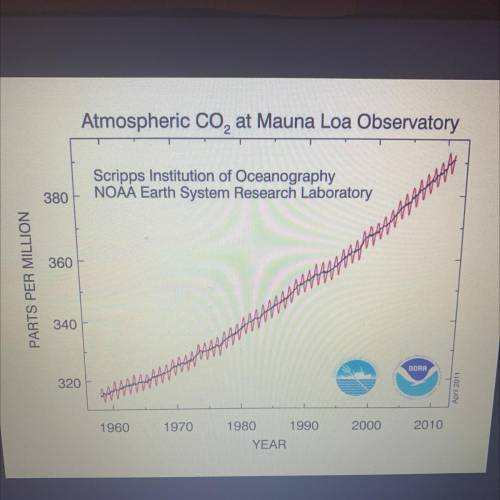
The graph indicates what about the relationship between atmospheric carbon dioxide and time
-))
A)
over time, the amount of atmospheric carbon dioxide increases
B)
over time, the amount of atmospheric carbon dioxide decreases
over time, the amount of atmospheric carbon dioxide stays the same
D)
over time, the amount of atmospheric carbon dioxide does not change

Answers: 3


Another question on Biology
Biology, 22.06.2019 01:00
Coral reefs support more species per unit area than any other marine environment on earth. what is one way coral reefs are important to the health of the biosphere
Answers: 1
Biology, 22.06.2019 04:50
Consider the classification levels of a human. eukarya ,animalia ,chordata ,mammalia ,primates, hominidae ,homo ,sapiens .which is the most specific taxonomic level in the classification system above? a sapiens b homo c hominidae d primates
Answers: 1
Biology, 22.06.2019 11:30
Suppose that on a small island off the coast of scotland, 32 percent of the population has blue eyes, which means that these individuals must be homozygous for the blue eye color gene (bb). the only other eye color found on the island is brown, and individuals that are homozygous for the brown eye color gene (bb) or heterozygous (bb) will have brown eyes because brown is the dominant gene. assume this population is in hardy-weinberg equilibrium. if 100 babies are born next year, how many of these would you expect to have brown eyes and be heterozygous? a. 58 b. 49 c. 29 d. 43
Answers: 1
You know the right answer?
The graph indicates what about the relationship between atmospheric carbon dioxide and time
-))
Questions


Chemistry, 04.03.2021 16:40

Mathematics, 04.03.2021 16:40
Mathematics, 04.03.2021 16:40
Mathematics, 04.03.2021 16:40

English, 04.03.2021 16:40
Biology, 04.03.2021 16:40
Mathematics, 04.03.2021 16:40

Advanced Placement (AP), 04.03.2021 16:40
History, 04.03.2021 16:40

Physics, 04.03.2021 16:40


