1 pts
Question 3
3. Based on the table below, what pattern do you see in the data?
Tabl...

Biology, 17.12.2020 17:50 shaakiraak
1 pts
Question 3
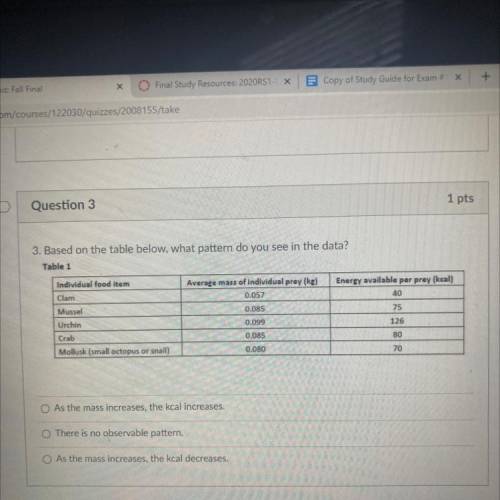
3. Based on the table below, what pattern do you see in the data?
Table 1
Energy available per prey (kcal)
40
75
Individual food item
Clam
Mussel
Urchin
Crab
Mollusk (small octopus or snail)
Average mass of individual prey (ke)
0.057
0.085
0.099
0.085
0.080
126
80
70
As the mass increases, the kcal increases.
There is no observable pattern.
O As the mass increases, the kcal decreases.

Answers: 2


Another question on Biology
Biology, 22.06.2019 10:00
1. fold your hands together so your thumbs cross over ,and look at your thumbs. which thumb feels most "comfortable" on top is actually controlled by a gene. the left thumb folding over the right thumb is a domi
Answers: 3
Biology, 23.06.2019 00:20
Why does competiton happen? a: different organisms have different needsb: there are limited resources in an ecosystemc: there are no predators in an ecosystemd: organisms do not need the same resources (i think it's b but i'm not sure)
Answers: 2
Biology, 23.06.2019 01:10
Which of the following terms describes water that is safe to drink? clean filtered potable sterilized
Answers: 2
Biology, 23.06.2019 08:00
Witch element is capble of forming long chains by forming single and double or triple bonds with its self
Answers: 1
You know the right answer?
Questions


Chemistry, 21.01.2021 23:20


English, 21.01.2021 23:20
Biology, 21.01.2021 23:20
Mathematics, 21.01.2021 23:20


