
Biology, 27.01.2021 02:50 lizethyyaritza16
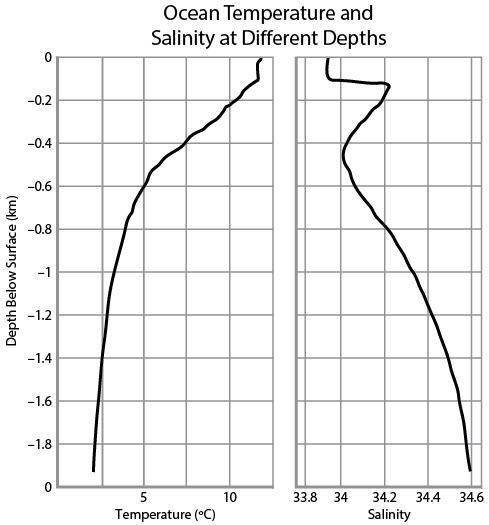
The graphs below show the change in temperature and salinity of a region of ocean as an instrument is lowered below the surface. Depth is measured in kilometers below the surface, temperature in degrees Celsius, and salinity in parts per thousand.
Image of two graphs. The left graph has the x-axis labeled temperature (degree C) ranging from 0 to 10. The y-axis is labeled depth below surface (km) ranging from -1.8 to 0. The line on graph goes up vertically starting at about 2 °C on the x-axis and -1.9 km on the y-axis. The vertical line goes up staying at about 2 degree C and climbs from -1.9 km to about -0.8 km. The line starts to shift right at -0.6 km. The line shifts to the right from 2 degree C to 5 degree C. The line shifts to right more starting at -0.5 km and reaches 10 °C around -0.2 km. The line continues up vertically after -0.2 km. The right graph has the x-axis labeled salinity ranging from 33.8 to 34.6. The y-axis is labeled depth below surface (km) ranging from -1.8 to 0. The line on the graph starts at 34 on the x-axis and 0 km on the y-axis. The line starts to shift to the right at -0.1 km and levels out at 34.2 on the x-axis. At -0.2 km the line shifts to the left and continues to shift left until it reaches -0.5 km. The line starts to shift to the right again at -0.6 and continues to shift right until it reaches -1.9 km on the y-axis and 34.6 on the x-axis.
© 2015 protonsforbreakfast. wordpress
What is the most valid conclusion regarding ocean salinity based on the data?
Ocean salinity is not related to water temperature.
Ocean salinity changes with depth at a steady rate throughout the entire water column.
Ocean salinity increases as ocean temperature decreases.
Ocean salinity is more stable at higher temperatures than at lower temperatures.

Answers: 1


Another question on Biology
Biology, 22.06.2019 00:30
Experiments in environmental toxicology can sometimes be manipulative experiments in which the researcher actively chooses and manipulates the independent variable. in hunt's study, for example, dosages of bpa were manipulated and the effects were measured. in manipulative studies, the researcher controls all the other variables in the experiment, so any health effects observed in the test subjects can be attributed to differences in the independent variable. in other cases, researchers use natural experiments in which the dependent variable (typically a measure of organism health) is measured under differing contexts that are not manipulated. say, for example, that an accidental chemical spill contaminates five ponds. to determine the possible effects of the toxic chemical on frogs, a researcher could compare the hatching rate of frog eggs laid in those five ponds to the hatching rate of eggs laid in five uncontaminated ponds nearby. this would be an example of a natural experiment because concentrations of the toxic chemical in the ponds were not controlled by the experimenter, but rather resulted from the chemical spill. drag type of experiment on the left to the example of experiment on the right. blood concentrations of bpa in college students are compared to their recent manipulative consumption of canned food items 2. the feeding behavior of fish in streams that receive acidic runoff from strip mines is compared to the feeding behavior of fish in unaffected streams. the deformity rate in baby birds from nests in pesticide-sprayed fields is compared to the deformity rate in birds from nests in unsprayed fields 4 tumor development is compared in mice exposed to five dosages of a known carcinogen in the laboratory foraging activity levels are compared in tadpoles exposed to four concentrations of toxic metals in the laboratory. growth of corn plants is compared in field plots sprayed with three different dosage: s of weed killer 7 bpa concentrations in the urine of people with diabetes are compared to bpa concentrations in the urine of people without diabetes - natural; manipulative
Answers: 1
Biology, 22.06.2019 09:00
Toorale man murder mystery < - your lab link 1. how was the toorale man found? 2. what did archaeologists learn about the burial? why is the burial important? 3. what information were the scientists able to learn from the skeleton itself? 4. why is the question of whether the injuries came from a stone or steel weapon important? how could scientists distinguish between the different types of weapons? 5. what did the carbon dating and soil testing tell scientists about toorale man? why are the dates interesting for scientists?
Answers: 3
Biology, 22.06.2019 09:00
What should be the strand of complementary dna produced by the strand of dna shown below cgt ata
Answers: 1
You know the right answer?
The graphs below show the change in temperature and salinity of a region of ocean as an instrument i...
Questions

Mathematics, 23.08.2019 05:30
Mathematics, 23.08.2019 05:30


Chemistry, 23.08.2019 05:30
Mathematics, 23.08.2019 05:30

Geography, 23.08.2019 05:30
Chemistry, 23.08.2019 05:30
Biology, 23.08.2019 05:30

Mathematics, 23.08.2019 05:30
Mathematics, 23.08.2019 05:30
Mathematics, 23.08.2019 05:30
Geography, 23.08.2019 05:30
Mathematics, 23.08.2019 05:30


