
Biology, 28.01.2021 17:20 castellon67
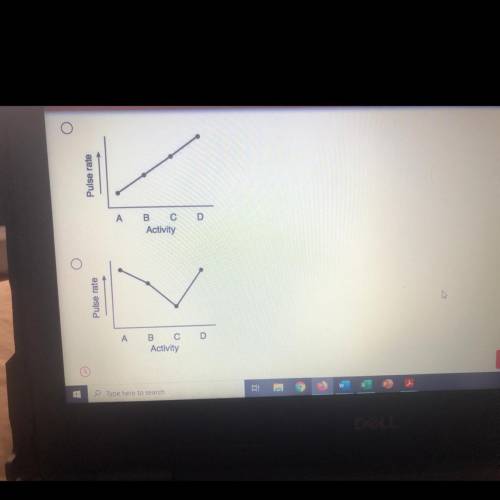
A student measures his pulse rate while he is watching television and records it. Next,
he walks to a friend's house nearby and when he arrives, measures and records his
pulse rate again. He and his friend then decide to run to the mall a few blocks away. On
arriving at the mall, the student measures and records his pulse rate once again.
Finally, after sitting and talking for a half hour, the student measures and records his
pulse rate for the last time.
Which graph below best illustrates the expected changes in his pulse rate according to
the activities described above?
Key:Activity
A = after watching
television
B = after walking to a
friend's house
C = after running to
the mall
D = after sitting and
talking

Answers: 1


Another question on Biology
Biology, 22.06.2019 02:00
What is the next step in muscle contraction after the actin changes shape? (apex)
Answers: 1
You know the right answer?
A student measures his pulse rate while he is watching television and records it. Next,
he walks to...
Questions

History, 19.10.2021 07:40

Mathematics, 19.10.2021 07:40
Mathematics, 19.10.2021 07:40
Mathematics, 19.10.2021 07:40

English, 19.10.2021 07:40


Mathematics, 19.10.2021 07:50
Mathematics, 19.10.2021 07:50
Geography, 19.10.2021 07:50
Mathematics, 19.10.2021 07:50

Biology, 19.10.2021 07:50


