
Biology, 09.02.2021 01:00 desderievelasquez
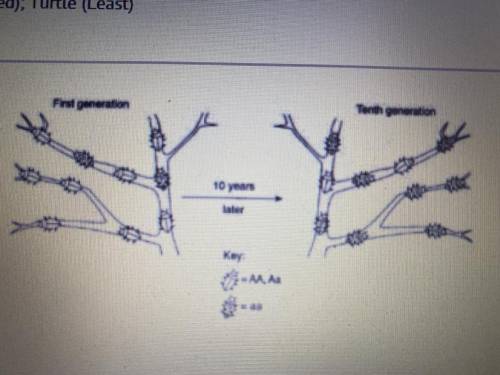
The diagram illustrates the change that occurred in a bug population over 10 years, a probable explanation for this change would be that over time there was -
A) A decrease in the frequency of allele “a” to adapt
B) An increase in the frequency of allele “a” to adapt
C) An increase in the population of the insect
D) A decrease in the mutation rate of allele “A”

Answers: 1


Another question on Biology
Biology, 21.06.2019 13:30
Many state and local authorities are making laws regarding recreation on lakes, rivers, and oceans to reduce water pollution. why would lawmakers need to consult with scientists before making these laws? a) to make scientists feel important b) so that the laws reduce pollution by a sufficient amount c) so that parks and lakefront facilities will still make large profits d) so that the public will believe that the laws are important to follow
Answers: 1
Biology, 22.06.2019 02:00
Identify the terms using the following picture. principle of dominance item 1 can be described as the . item 2 can be described as the . the "p" represents from one parent.
Answers: 3
Biology, 22.06.2019 05:00
What function does a limb serve in each animal how are the limb bones of the four animal similar based on the similarities what can be inferred about the evolution of the poor animals
Answers: 1
You know the right answer?
The diagram illustrates the change that occurred in a bug population over 10 years, a probable expla...
Questions

History, 14.01.2021 20:50

Mathematics, 14.01.2021 20:50
SAT, 14.01.2021 20:50

Chemistry, 14.01.2021 20:50
Mathematics, 14.01.2021 20:50

Health, 14.01.2021 20:50
Mathematics, 14.01.2021 20:50
History, 14.01.2021 20:50
Mathematics, 14.01.2021 20:50
Mathematics, 14.01.2021 20:50
Mathematics, 14.01.2021 20:50
Biology, 14.01.2021 20:50
Mathematics, 14.01.2021 20:50


