
Biology, 11.03.2021 17:30 animeisstupid6
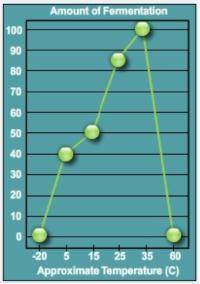
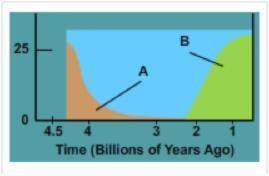
3. Each graph shows a causal or correlational relationship between changes in the biosphere and changes in Earth’s other systems. Explain the causal or correlational relationship each graph represents. I just want to know which one(s) causal and which one(s) correlational, and why.

Answers: 1


Another question on Biology
Biology, 21.06.2019 19:30
During a hot day, warm and moist air rises and cools in the atmosphere. which even would occur next on such a day? a. condensed droplets would gather to become water vapor. b. water vapor would condense into tiny droplets. c. water droplets would evaporate to form rain and snow.
Answers: 2
Biology, 22.06.2019 00:00
Question 1 of 102 pointswhich best describes adaptive radiation? oa. geographical isolation caused by an adaptationob. biodiversity resulting from few ancestorsoc. a decrease in the rate of speciationd. adaptations that organisms teach each other
Answers: 2
Biology, 22.06.2019 05:10
1) what three conditions must be present for minerals to form through natural processes? 2) why are minerals considered inorganic substances? 3) how do oxides differ from other minerals that contain oxygen atoms? 4) how is a sulfide different from a sulfate? what makes native elements unique?
Answers: 2
Biology, 22.06.2019 09:00
Which of the following statements about protists are true? a.they are typically found in moist environments. b.they are all unicellular. c.they have a nucleus. d.they are all multicellular.
Answers: 1
You know the right answer?
3. Each graph shows a causal or correlational relationship between changes in the biosphere and chan...
Questions


Mathematics, 30.11.2020 08:50


Computers and Technology, 30.11.2020 08:50

History, 30.11.2020 08:50
Mathematics, 30.11.2020 08:50

English, 30.11.2020 08:50
Biology, 30.11.2020 08:50
English, 30.11.2020 08:50
Computers and Technology, 30.11.2020 08:50
Biology, 30.11.2020 08:50
Mathematics, 30.11.2020 08:50
Mathematics, 30.11.2020 08:50


