
Biology, 18.03.2021 02:30 sanchezvianna55
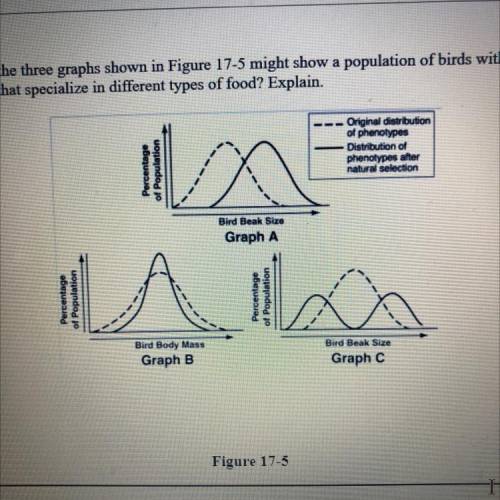
24. Which of the three graphs shown in Figure 17-5 might show a population of birds with
members that specialize in different types of food? Explain.
Percentage
of Population
Original distribution
of phenotypes
Distribution of
phenotypes after
natural selection
Bird Beak Size
Graph A
Percentage
of Population
Percentage
of Population
Bird Beak Size
Bird Body Mass
Graph B
Graph C

Answers: 1


Another question on Biology
Biology, 22.06.2019 06:30
What function does the limb sever in each animal? how are the limb bones of the four animals similar? based on these similarities what can be inferred about the evolution of the four animals.
Answers: 2
Biology, 22.06.2019 09:20
Which statement explains how gravity and intertia work together
Answers: 1
Biology, 22.06.2019 11:30
Use the distance formula to determine weather each pair of segments have the same length
Answers: 1
You know the right answer?
24. Which of the three graphs shown in Figure 17-5 might show a population of birds with
members th...
Questions

Biology, 21.09.2019 20:30

Chemistry, 21.09.2019 20:30

History, 21.09.2019 20:30
Mathematics, 21.09.2019 20:30
Mathematics, 21.09.2019 20:30
Mathematics, 21.09.2019 20:30

English, 21.09.2019 20:30
Mathematics, 21.09.2019 20:30

Business, 21.09.2019 20:30


