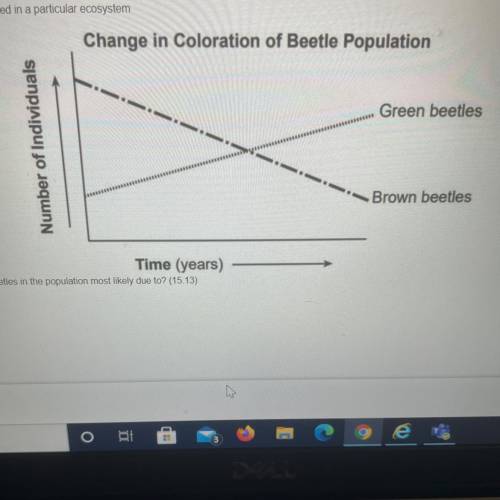
The graph below represents the number of brown and green beetles collected in a particular ecosystem.
what is the change observed in the number of green and brown beetles in the population most likely due to?
A) natural selection
B) gene mutation
C) a common ancestor
D) selective breeding


Answers: 2


Another question on Biology

Biology, 21.06.2019 23:00
Aflashlight battery is an example of a) potential energy b) kinetic energy c) thermal energy d) solar energy
Answers: 3

Biology, 22.06.2019 01:20
And give a detailed description! scientist observes the boundary between two tectonic plates for a decade and finds that no new volcanoes have formed over the course of her investigation. does this result support the theory of plate tectonics? why or why not?
Answers: 3

Biology, 22.06.2019 13:00
Dna, in the nucleus carries the genetic code for making proteins in ribosomes. in the diagram, b, represents the proteins produced. dna cannot leave the nucleus to carry the genetic information to the ribosome where proteins are produced. how does the genetic code get from the nucleus to the ribosome? what does a represent? now
Answers: 1

Biology, 22.06.2019 15:40
The cell membrane controls what enters and leaves the cell. which of the structures in the diagram below is the cell membrane? — f оооо
Answers: 1
You know the right answer?
The graph below represents the number of brown and green beetles collected in a particular ecosystem...
Questions

History, 27.12.2019 11:31

Advanced Placement (AP), 27.12.2019 11:31


Mathematics, 27.12.2019 11:31

Mathematics, 27.12.2019 11:31

Mathematics, 27.12.2019 11:31


English, 27.12.2019 11:31


Mathematics, 27.12.2019 11:31

Mathematics, 27.12.2019 11:31


Geography, 27.12.2019 11:31

History, 27.12.2019 11:31

Mathematics, 27.12.2019 11:31


Mathematics, 27.12.2019 11:31

Mathematics, 27.12.2019 11:31


