
Biology, 19.03.2021 18:40 jameskatzfeystu70
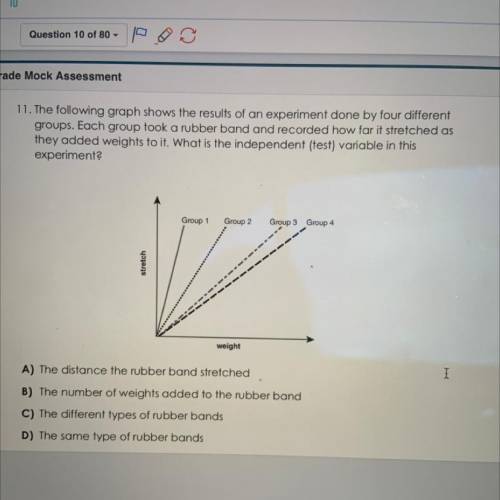
11. The following graph shows the results of an experiment done by four different
groups. Each group took a rubber band and recorded how far it stretched as
they added weights to it. What is the independent (test) variable in this
experiment?
Group 1
Group 2
Group 3 Group 4
stretch
weight
I
A) The distance the rubber band stretched
B) The number of weights added to the rubber band
C) The different types of rubber bands
D) The same type of rubber bands

Answers: 2


Another question on Biology
Biology, 22.06.2019 00:20
Apart of an ecosystem that can restrict the growth of a population is referred to as
Answers: 1
Biology, 22.06.2019 01:20
And give a detailed description! scientist observes the boundary between two tectonic plates for a decade and finds that no new volcanoes have formed over the course of her investigation. does this result support the theory of plate tectonics? why or why not?
Answers: 3
Biology, 22.06.2019 06:30
Prior to the mt. st. helens eruption on may 18, 1980, satellite and topographic views of the volcano were captured. based on the topographic map of mt. st. helens, what is the contour interval if the volcano height is 2,950 m? question 9 options: 600 m 400 m 750 m 500 m
Answers: 3
You know the right answer?
11. The following graph shows the results of an experiment done by four different
groups. Each grou...
Questions

Mathematics, 23.09.2019 14:50

English, 23.09.2019 14:50
Mathematics, 23.09.2019 14:50

Mathematics, 23.09.2019 14:50

Mathematics, 23.09.2019 14:50
Mathematics, 23.09.2019 14:50
Mathematics, 23.09.2019 14:50
Mathematics, 23.09.2019 14:50

Health, 23.09.2019 14:50
Mathematics, 23.09.2019 14:50

Geography, 23.09.2019 14:50


