
Biology, 20.03.2021 02:10 kenziepickup
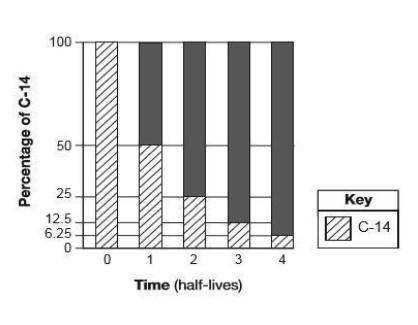
A bar graph of the radioactive decay of carbon-14 is shown below.
Carbon-14 decays to Nitrogen-14. The solid black sections of the bars on the graph represent the percentages of _.
(A) carbon-14 from the original sample that has not decayed
(B) uranium-238 from the original sample that has not decayed
(C) nitrogen-14 decay product resulting from the radioactive decay
(D) lead-206 decay product resulting from the radioactive decay

Answers: 2


Another question on Biology
Biology, 21.06.2019 21:20
Which codon is the code for the amino acid histidine (his)?
Answers: 1
Biology, 22.06.2019 04:00
Food contains a sugar called ( ), which is broken down in a process called cellular ( ). this process uses ( ) to break down food molecules and provide energy for cells. fill in the parentheses
Answers: 2
Biology, 22.06.2019 08:00
Which best example best demonstrates the importance of having knowledge of evolutionary relationships? a. illustration of a plant b.organ transplantation between species c. blood donation from a human d. do you need sequence of an insect.
Answers: 1
Biology, 22.06.2019 09:00
What substance is the most acidic. lemon juice. tomato juice. sodium hydroxide. water
Answers: 1
You know the right answer?
A bar graph of the radioactive decay of carbon-14 is shown below.
Carbon-14 decays to Nitrogen-14...
Questions

Mathematics, 16.07.2019 12:30
Mathematics, 16.07.2019 12:30
Mathematics, 16.07.2019 12:30


History, 16.07.2019 12:30

Geography, 16.07.2019 12:30


