
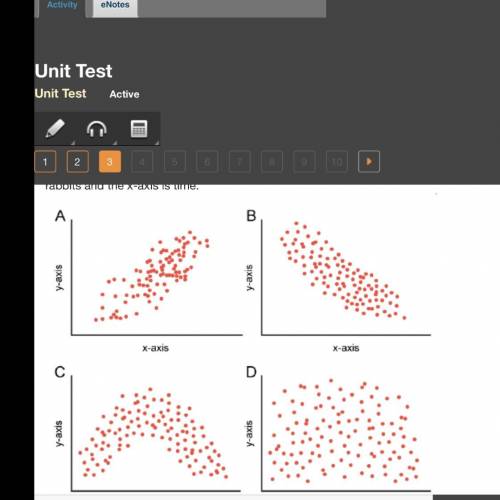
The scatterplots indicate the population of rabbits in the population over time. The y-axis represents the number of rabbits and the x-axis is time.
Which graph most likely represents a rabbit population that found a new, larger habitat, but then eventually experienced an increase in predation?
Graph A
Graph B
Graph C
Graph D

Answers: 1


Another question on Biology
Biology, 22.06.2019 00:40
Which would best keep the oxygen cycle stable? a. cutting down jungles to create farmland b. eliminating parks in large cities c. dumping toxic chemicals into the ocean d. reducing the amount of deforestation d. reducing the amount of deforestation
Answers: 1
Biology, 22.06.2019 04:00
1) strawberry plants typically reproduce by making runners, which are miniature versions of themselves, that grow off of the roots and stems of the parent. this type of vegetative reproduction is known as a) pollination. b) fragmentation. c) binary fission. d) vegetative propogation.
Answers: 2
Biology, 22.06.2019 04:40
The cluster of developing cells from conception until birth is called an
Answers: 1
Biology, 22.06.2019 07:30
Ture or false evidence for evolution includes millions of fossils
Answers: 1
You know the right answer?
The scatterplots indicate the population of rabbits in the population over time. The y-axis represen...
Questions


Social Studies, 23.07.2019 05:00

History, 23.07.2019 05:00
Mathematics, 23.07.2019 05:00


Chemistry, 23.07.2019 05:10


Mathematics, 23.07.2019 05:10
Chemistry, 23.07.2019 05:10
Mathematics, 23.07.2019 05:10
History, 23.07.2019 05:10


