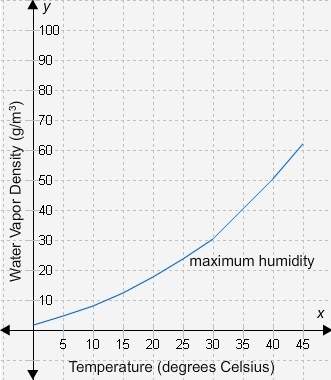
The graph shows the maximum amount of water vapor that air can hold at different temperatures.
...

Biology, 20.12.2019 09:31 paradisetiyae5261
The graph shows the maximum amount of water vapor that air can hold at different temperatures.
beth’s hygrometer is reading a temperature of 30°c and a relative humidity of 65%. the humidity in the air is grams/cubic meter.
38.5
30
19.5
13.5

Answers: 2


Another question on Biology
Biology, 22.06.2019 02:00
The united states produces an average of 429 billion pounds of food annually. about 133 billion pounds of that food ends up as waste.the percentage of food that the united states wastes each year is %.
Answers: 2
Biology, 22.06.2019 03:30
If assuming tasting ptc as a simple gene trait,what other genotype would you select to put in this missing genotype box that could result in this phenotype
Answers: 3
Biology, 22.06.2019 08:00
What advantages does a pedigree have over a written passage?
Answers: 3
You know the right answer?
Questions

Mathematics, 11.03.2021 18:20
Mathematics, 11.03.2021 18:20
Mathematics, 11.03.2021 18:20
Mathematics, 11.03.2021 18:20

Chemistry, 11.03.2021 18:20
Mathematics, 11.03.2021 18:20
Mathematics, 11.03.2021 18:20
Mathematics, 11.03.2021 18:20
Mathematics, 11.03.2021 18:20

English, 11.03.2021 18:20
Mathematics, 11.03.2021 18:20
Mathematics, 11.03.2021 18:20


