
Biology, 16.09.2019 22:00 robertcoe426
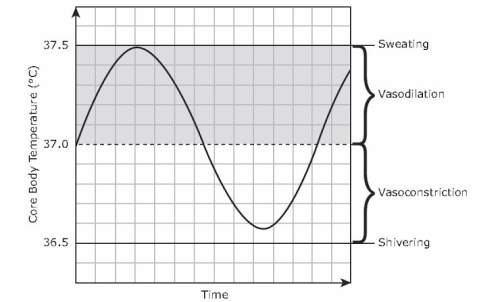
The graph models core body temperature during a rapid change in environmental conditions. which statement explains the pattern in the graph?
a. body temperature varies in a predictable pattern during the day.
b. body temperature is controlled by an internal feedback mechanism.
c. vasodilation and vasoconstriction are dependent on the time of day.
d. vasodilation and vasoconstriction trigger an immediate increase in body temperature.

Answers: 1


Another question on Biology
Biology, 21.06.2019 19:40
The many volcanoes located along the edge of the pacific ocean make up the ring of fire. how does subduction play a role in the volcanic activity in the ring of fire?
Answers: 1
Biology, 21.06.2019 23:40
The following hormone had their receptors in the cell membrane except a-insulin b-tsh c-gh d- cortisol
Answers: 1
Biology, 22.06.2019 00:00
How does a lytic infection differ from a lysogenic infection?
Answers: 1
Biology, 22.06.2019 03:00
Johnny rode his bike to a friend's house 4 blocks down the street in his neighborhood. he immediately rode back home once he realized his friend was not able to play. what was his displacement for the total bike ride? how did you determine this? what could we use as a reference point to determine he was in motion during his bike ride? why can you use it as a reference point
Answers: 1
You know the right answer?
The graph models core body temperature during a rapid change in environmental conditions. which stat...
Questions

Social Studies, 31.08.2019 00:30


Geography, 31.08.2019 00:30

Mathematics, 31.08.2019 00:30

Mathematics, 31.08.2019 00:30
Mathematics, 31.08.2019 00:30
Mathematics, 31.08.2019 00:30
History, 31.08.2019 00:30
History, 31.08.2019 00:30


