
Biology, 02.05.2021 19:40 Angelofpink2590
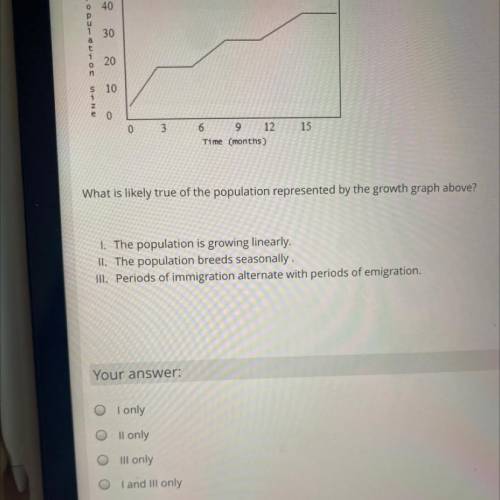
What is likely true of the population represented by the growth graph above?
1. The population is growing linearly.
II. The population breeds seasonally.
III. Periods of immigration alternate with periods of emigration.

Answers: 3


Another question on Biology
Biology, 22.06.2019 04:50
Consider the classification levels of a human. eukarya ,animalia ,chordata ,mammalia ,primates, hominidae ,homo ,sapiens .which is the most specific taxonomic level in the classification system above? a sapiens b homo c hominidae d primates
Answers: 1
Biology, 22.06.2019 11:00
Astudent poured a solution of bromothymol blue indicator into three test tubes. then he placed an aquatic plant in two of the test tubes, as shown below. he placed a stopper on each test tube and placed them all in the dark for 24 hours. bromothymol blue turns from blue to yellow in the presence of co2
Answers: 2
Biology, 22.06.2019 11:00
Match the following terms and definitions. 1. species that are adapted to live in equilibrium at carrying capacity population density 2. population growth that reaches equilibrium and carrying capacity population 3. death rate mortality 4. birth rate k-selected 5. a group of interacting individuals of the same species within the same geographic area natality 6. the number of organisms living in a particular area logistic growth
Answers: 1
Biology, 22.06.2019 16:00
Why are some places regularly warmer or cooler than others in a given month
Answers: 3
You know the right answer?
What is likely true of the population represented by the growth graph above?
1. The population is...
Questions


English, 05.05.2020 07:42

Health, 05.05.2020 07:42
History, 05.05.2020 07:42
English, 05.05.2020 07:42
Mathematics, 05.05.2020 07:42

Social Studies, 05.05.2020 07:42
Mathematics, 05.05.2020 07:42
Mathematics, 05.05.2020 07:42


English, 05.05.2020 07:42


