Biology, 06.05.2021 22:40 alyxkellar06
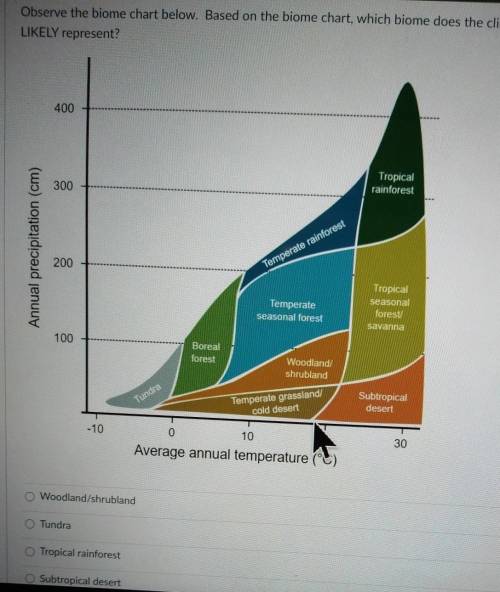
Observe the biome chart below. Based on the biome chart, which biome does the climatograph above MOST LIKELY represent? 400 Tropical rainforest 300 Annual precipitation (cm) 200 Temperate rainforest Temperate seasonal forest Tropical seasonal forest savanna 100 Boreal forest Woodland/ shrubland Subtropical desert Tundra Temperate grasslar cold desert -10 30 0 10 20 Average annual temperature (°C) O Woodland/shrubland O Tundra O tropical rainforest O subtropical desert


Answers: 3


Another question on Biology

Biology, 21.06.2019 14:10
Select the correct answer. which formula describes newton’s second law of motion? a. force=mass x accerlaration b. mass/accerlaration c. mass x volacity d. mass/ volacity
Answers: 2

Biology, 21.06.2019 17:00
Which of the following is an example of this type of co-evolution
Answers: 3

Biology, 21.06.2019 18:10
Drag each label to the correct location on the image. g organisms adopt different strategies and structures to make sure their offspring it uses. herds young into center of group produces many offspring at once to protect against high predation risk protects offspring until environmental conditions are ideal for growth coo b 13 1994 7 odos si . an . i
Answers: 3

Biology, 22.06.2019 05:00
Penelope studies how the structure and function of the nervous system is related to behavior. she is a psychologist
Answers: 1
You know the right answer?
Observe the biome chart below. Based on the biome chart, which biome does the climatograph above MOS...
Questions


Mathematics, 01.09.2021 06:20

Business, 01.09.2021 06:20

Mathematics, 01.09.2021 06:20


Physics, 01.09.2021 06:20

Mathematics, 01.09.2021 06:20

Mathematics, 01.09.2021 06:20

Mathematics, 01.09.2021 06:20

English, 01.09.2021 06:20

Chemistry, 01.09.2021 06:20

Mathematics, 01.09.2021 06:20


History, 01.09.2021 06:20

Mathematics, 01.09.2021 06:20


Mathematics, 01.09.2021 06:20


