
Biology, 19.05.2021 17:30 jeffffffff
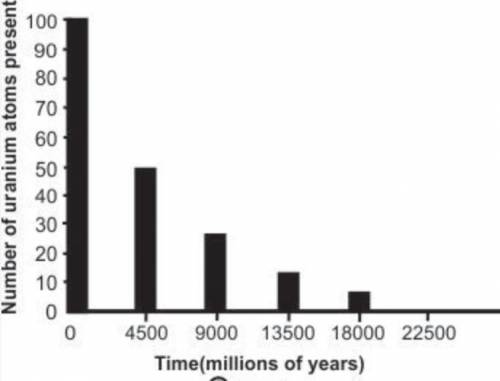
The graph below shows the radioactive decay of an isotope of uranium.
Bar graph showing time in millions of years on x axis and number of uranium atoms present on y axis. Height of bar corresponding to time 0 million years is 100; time 4500 million years is 50; time 9000 million years is 25; time 13,500 million years is 12.5; and time 18,000 million years is 6.25.
Based on the graph, what is the half-life of uranium?
50 years
100 years
4,500 years
9,000 years

Answers: 2


Another question on Biology
Biology, 22.06.2019 07:00
The is an estimate of the fewest number of organisms a population needs to avoid extinction. this measurement will most if the number of offspring each female in the population produces increases. if the population's this measurement will most likely increase. 1 population density, minimum viable population, carrying capacity 2 decrease, be unaffected, increase 3 death rate increase, dead rate decrease
Answers: 2
Biology, 22.06.2019 08:10
What is the next step in the process after a substrate enters the active site of an enzyme
Answers: 1
Biology, 22.06.2019 09:30
Hemoglobin is a proton that carries oxygen around the body what is hemoglobin made from
Answers: 1
You know the right answer?
The graph below shows the radioactive decay of an isotope of uranium.
Bar graph showing time in mil...
Questions

Biology, 10.12.2019 02:31

Chemistry, 10.12.2019 02:31
Physics, 10.12.2019 02:31

Mathematics, 10.12.2019 02:31
Mathematics, 10.12.2019 02:31
Mathematics, 10.12.2019 02:31

English, 10.12.2019 02:31

Mathematics, 10.12.2019 02:31
Chemistry, 10.12.2019 02:31
Mathematics, 10.12.2019 02:31
Mathematics, 10.12.2019 02:31
Mathematics, 10.12.2019 02:31
Mathematics, 10.12.2019 02:31
Mathematics, 10.12.2019 02:31


