
An instrument is gradually lowered beneath the surface of the ocean to measure the temperature and salinity of the water. The graphs below show the change in temperature at each depth in kilometers below the surface.
Image of two graphs. The left graph has the x axis labeled temperature degree C ranging from 0 to 10. The y axis is labeled depth below surface, km, ranging from negative 1.8 to 0. The line on graph goes up vertically starting at about 2 degree C on the x axis and negative 1.9 km on the y axis. The vertical line goes up staying at about 2 degree C and climbs from negative 1.9 km to about negative 0.8 km. The line starts to shift right at negative 0.6 km. The line shifts to the right from 2 degree C to 5 degree C. The line shifts to right more starting at negative 0.5 km and reaches 10 degree C around negative 0.2 km. The line continues up vertically after negative 0.2 km. The right graph has the x axis labeled salinity ranging from 33.8 to 34.6. The y axis is labeled depth below surface, km, ranging from negative 1.8 to 0. The line on the graph starts at 34 on the x axis and 0 km on the y axis. The line starts to shift to the right at negative 0.1 km and levels out at 34.2 on the x axis. At negative 0.2 km the line shifts to the left and continues to shift left until it reaches negative 0.5 km. The line starts to shift to the right again at negative 0.6 and continues to shift right until it reaches negative 1.9 km on the y axis and 34.6 on the x axis.
What is the most valid conclusion regarding ocean depth temperature, based on the data?
A.) The temperature and salinity increase with increasing depth.
B.) The salinity increases as the depth goes closer to zero.
C.) The bottom of the ocean is frozen and salinity levels are low.
D.) The ocean temperature never rises above 10°C and salinity remains constant.
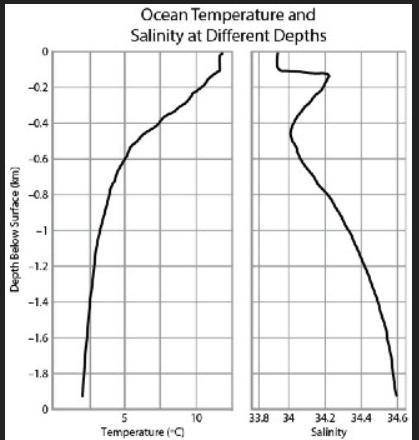

Answers: 3


Another question on Biology
Biology, 22.06.2019 01:10
Osmosis is often viewed incorrectly as a process driven directly by differences in solute concentration across a selectively permeable membrane. what really drives osmosis? view available hint(s)osmosis is often viewed incorrectly as a process driven directly by differences in solute concentration across a selectively permeable membrane. what really drives osmosis? the first law of thermodynamicsthe difference in the height of water columns on either side of a selectively permeable membranethe difference in water concentration across a selectively permeable membranethe difference in sugar or ion concentration across a selectively permeable membrane
Answers: 2
Biology, 22.06.2019 02:50
Cells destroy body cells infected by a virus or bacteria. killer t t memory t none of the above
Answers: 2
Biology, 22.06.2019 03:00
Afisherman is dragging his boat from the shore out into the ocean. match the following lists of areas he will move over in the correct order. continental rise continental slope continental shelf [tex]1.[/tex] [tex]2.[/tex] [tex]3.[/tex]
Answers: 1
Biology, 22.06.2019 07:00
What is the main function of the central vacuole in a plant cell? a. absorbs energy from the sun to produce food b. holds water and maintains turgor pressure c. breaks down molecules to release energy d. contains the cell's genetic material
Answers: 1
You know the right answer?
An instrument is gradually lowered beneath the surface of the ocean to measure the temperature and s...
Questions


Mathematics, 15.11.2021 01:00

Health, 15.11.2021 01:00


Mathematics, 15.11.2021 01:00

English, 15.11.2021 01:00
Mathematics, 15.11.2021 01:00
Mathematics, 15.11.2021 01:00
Mathematics, 15.11.2021 01:00
English, 15.11.2021 01:00


