
Business, 20.09.2019 00:00 live4dramaoy0yf9
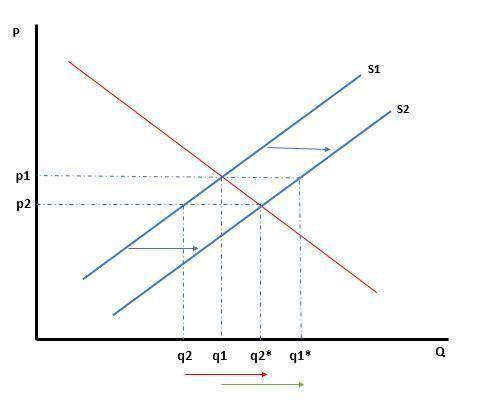
Suppose that at prices of $1, $2, $3, $4, and $5 for product z, the corresponding quantities supplied are 3, 4, 5, 6, and 7 units, respectively. which of the following would increase the quantities supplied of z to, say, 6, 8, 10, 12, and 14 units at these prices? a. improved technology for producing zb. an increase in the prices of the reasources used to make zc. an increase in the excise tax on product zd. increase in the incomes of the buyers of z

Answers: 1


Another question on Business
Business, 22.06.2019 11:40
In each of the following, what happens to the unemployment rate? does the unemployment rate give an accurate impression of what’s happening in the labor market? a.esther lost her job and begins looking for a new one.b.sam, a steelworker who has been out of work since his mill closed last year, becomes discouraged and gives up looking for work.c.dan, the sole earner in his family of 5, just lost his $90,000 job as a research scientist. immediately, he takes a part-time job at starbucks until he can find another job in his field.
Answers: 2
Business, 22.06.2019 12:30
Consider a treasury bill with a rate of return of 5% and the following risky securities: security a: e(r) = .15; variance = .0400 security b: e(r) = .10; variance = .0225 security c: e(r) = .12; variance = .1000 security d: e(r) = .13; variance = .0625 the investor must develop a complete portfolio by combining the risk-free asset with one of the securities mentioned above. the security the investor should choose as part of her complete portfolio to achieve the best cal would be a. security a b. security b c. security c d. security d
Answers: 3
Business, 22.06.2019 18:00
Large public water and sewer companies often become monopolies because they benefit from although the company faces high start-up costs, the firm experiences average production costs as it expands and adds more customers. smaller competitors would experience average costs and would be less
Answers: 1
Business, 22.06.2019 19:00
The demand curve determines equilibrium price in a market. is a graphical representation of the relationship between price and quantity demanded. depicts the relationship between production costs and output. is a graphical representation of the relationship between price and quantity supplied.
Answers: 1
You know the right answer?
Suppose that at prices of $1, $2, $3, $4, and $5 for product z, the corresponding quantities supplie...
Questions

Chemistry, 03.09.2020 18:01


Mathematics, 03.09.2020 18:01
Mathematics, 03.09.2020 18:01
Mathematics, 03.09.2020 18:01
English, 03.09.2020 18:01

English, 03.09.2020 19:01


