
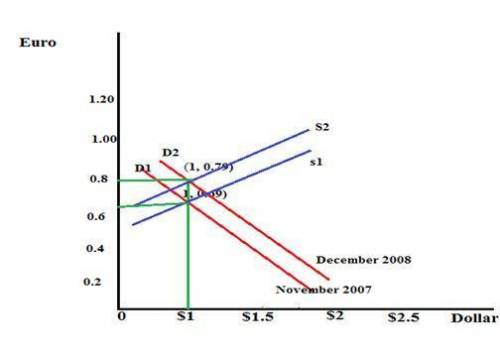
Using the data below, we are now going to use our supply/demand framework for us $ to model the movement in the euro per $ exchange rate between december 2007 (the very beginning of the great recession) and november 2008 (pretty much the height of the global financial crisis). note that the data is given in $ per euro and then converted into euro per dollar. for example, $ 1.2 per euro is converted by 1/1.2 = .833 meaning that $1 = .83 euro (this is the vertical axis on your graph, i. e., euro per $).
draw a supply and demand diagram like we did numerous times in the lectures labeling the vertical axis as euro per $, the horizontal axis with quantity of dollars, the initial supply and demand curves labeled with 12/07, label this initial intersection point as point a. now explain what happened to each curve and why between 12/07 and 11/08. label as point b with your supply and demand curves labeled accordingly (hint: the two obvious facts during this period is that the 1) us was in a deep recession and 2) we were at the height of the (global) financial crisis (in 11/08). assume all else is constant.
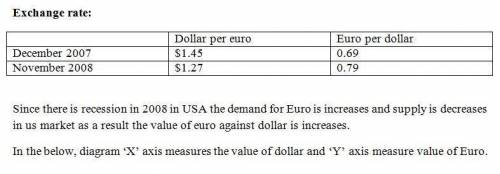
data:
12/1/2007 the dollar per euro exchange rate is $1.45, so the euro per dollar exchange rate is 1/1.45 = .69 euros per dollar.
11/1/2008 the dollar per euro exchange rate is $1.27, so the euro per dollar exchange rate is 1/1.27=.79 euros per dollar.

Answers: 1


Another question on Business
Business, 21.06.2019 20:30
Monetary policy in the united states is carried out primarily by which of the following agencies? a. the department of the treasury b. the small business association c. the federal reserve bank d. the u.s. mint 2b2t
Answers: 1
Business, 22.06.2019 16:30
Which of the following has the largest impact on opportunity cost
Answers: 2
Business, 22.06.2019 20:00
Ajax corp's sales last year were $435,000, its operating costs were $362,500, and its interest charges were $12,500. what was the firm's times-interest-earned (tie) ratio? a. 4.72b. 4.97c. 5.23d. 5.51e. 5.80
Answers: 1
Business, 23.06.2019 02:00
Suppose that a major city’s main thoroughfare, which is also an interstate highway, will be completely closed to traffic for two years, from january 2014 to december 2015, for reconstruction at a cost of $535 million. if the construction company were to keep the highway open for traffic during construction, the highway reconstruction project would take much longer and be more expensive. suppose that construction would take four years if the highway were kept open, at a total cost of $800 million. the state department of transportation had to make its decision in 2014, one year before the start of construction (so that the first payment was one year away). so the department of transportation had the following choices: (i) close the highway during construction, at an annual cost of $267.5 million per year for two years. (ii) keep the highway open during construction, at an annual cost of $200 million per year for four years. now suppose the interest rate is 80%. calculate the present value of the costs incurred under each plan.
Answers: 3
You know the right answer?
Using the data below, we are now going to use our supply/demand framework for us $ to model the move...
Questions


Mathematics, 02.08.2019 19:30

Biology, 02.08.2019 19:30


