
Business, 24.12.2019 00:31 sriharin58ozhj9m
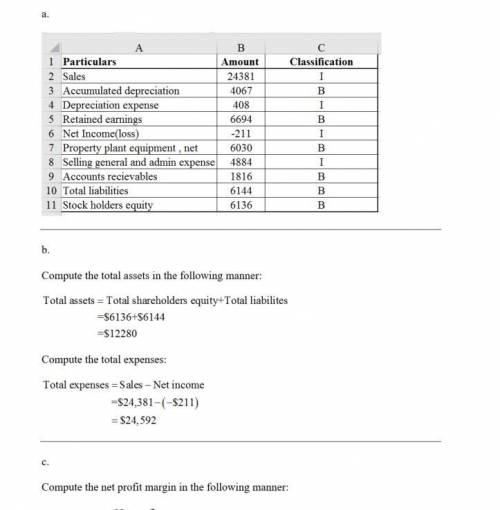
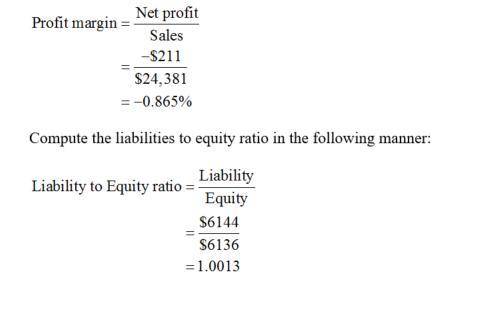
Identifying and classifying balance sheet and income statement accountsfollowing are selected accounts for staples, inc., for the fiscal year ended february 2, 2013(a) indicate whether each account appears on the balance sheet (b) or income statement (i).staples, inc. ($ millions) amount classificationsales $24,381 iaccumulated depreciation 4,067 bdepreciation expense 408 iretained earnings 6,694 b net income (loss) (211) iproperty, plant & equipment, net 6,030 bselling, general and admin expense 4,884 iaccounts receivable 1,816 btotal liabilities 6,144 bstockholders' equity 6,136 b(b) using the data, compute total assets and total expenses. i. total assetsii. total expenses(c) compute net profit margin (net income/sales) and total liabilities-to-equity ratio (total liabilities/stockholders' equity). (round your answers to two decimal places.)i. net profit marginii. total liabilities-to-equity ratio

Answers: 1


Another question on Business
Business, 21.06.2019 15:20
To make a profit while benefiting humanity is an example of a mission statement that what
Answers: 3
Business, 21.06.2019 22:30
Match the vocabulary word to the correct definition. 1. compensation 2. corporate social responsibility 3. discrimination 4. benefits 5. biodegradable a. a business’s obligation to the community and the environment b. the ability to naturally break down or decompose c. treating someone differently because of his or her race, religion,gender, sexual orientation, or disabilities d. indirect and non-cash compensation paid to employees e. the salary and other benefits for doing a job
Answers: 1
Business, 23.06.2019 01:00
As more people migrated west during the gold rush, what do you think happened to the demand curve in most western markets, holding all else constant? a. there was no shift, nor any increase or decrease in quantity demanded. b. there was no shift, but there was a decrease in quantity demanded. c. the demand curve shifted to the left. d. the demand curve shifted to the right. e. there was no shift, but there was an increase in quantity demanded.
Answers: 2
Business, 23.06.2019 03:20
Suppose that fixed costs for a firm in the automobile industry (start-up costs of factories, capital equipment, and so on) are $5 billion and that variable costs are equal to $17,000 per finished automobile. because more firms increase competition in the market, the market price falls as more firms enter an automobile market, or specifically, , where n represents the number of firms in a market. assume that the initial size of the u.s. and the european automobile markets are 300 million and 533 million people, respectively.a. calculate the equilibrium number of firms in the u.s. and european automobile markets without trade.b. what is the equilibrium price of automobiles in the united states and europe if the automobile industry is closed to foreign trade? c. now suppose that the united states decides on free trade in automobiles with europe. the trade agreement with the europeans adds 533 million consumers to the automobile market, in addition to the 300 million in the united states. how many automobile firms will there be in the united states and europe combined? what will be the new equilibrium price of automobiles? d. why are prices in the united states different in (c) and (b)? are consumers better off with free trade? in what ways?
Answers: 1
You know the right answer?
Identifying and classifying balance sheet and income statement accountsfollowing are selected accoun...
Questions

Chemistry, 24.12.2020 02:00


Mathematics, 24.12.2020 02:00
Mathematics, 24.12.2020 02:10

English, 24.12.2020 02:10


Chemistry, 24.12.2020 02:10
Mathematics, 24.12.2020 02:10
Mathematics, 24.12.2020 02:10
Chemistry, 24.12.2020 02:10

History, 24.12.2020 02:10

Geography, 24.12.2020 02:10


