
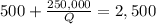
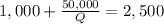
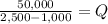
Alternative a would involve substantial fixed but relatively low variable costs: fixed costs would be $250,000 per year, and variable costs would be $500 per boat. subcontracting would involve a cost per boat of $2,500, and expansion would require an annual fixed cost of $50,000 and a variable cost of $1,000 per boat. question: at what level of output will location b yield its lowest total cost.

Answers: 3


Another question on Business
Business, 21.06.2019 19:40
Prairie, inc. produces one single product. it has an annual capacity of 10,000 units, but currently uses only 80% of it. each unit is sold for $50 and requires direct material worth $30 and direct labor worth $5. manufacturing overhead cost is $10 per unit of which 70% is variable. should a special order to sell 1,000 units at $44 be accepted? yes no
Answers: 2
Business, 22.06.2019 04:30
Annuity payments are assumed to come at the end of each payment period (termed an ordinary annuity). however, an exception occurs when the annuity payments come at the beginning of each period (termed an annuity due). what is the future value of a 13-year annuity of $2,800 per period where payments come at the beginning of each period? the interest rate is 9 percent. use appendix c for an approximate answer, but calculate your final answer using the formula and financial calculator methods. to find the future value of an annuity due when using the appendix tables, add 1 to n and subtract 1 from the tabular value. for example, to find the future value of a $100 payment at the beginning of each period for five periods at 10 percent, go to appendix c for n = 6 and i = 10 percent. look up the value of 7.716 and subtract 1 from it for an answer of 6.716 or $671.60 ($100 × 6.716)
Answers: 2
Business, 22.06.2019 08:00
Companies in the u.s. car rental market vary greatly in terms of the size of the fleet, the number of locations, and annual revenue. in 2011 hertz had 320,000 cars in service and annual revenue of approximately $4.2 billion. the following data show the number of cars in service (1000s) and the annual revenue ($ millions) for six smaller car rental companies (auto rental news website, august 7, 2012). excel file: data14-09.xls if required, enter negative values as negative numbers. a. select a scatter diagram with the number of cars in service as the independent variable. b. what does the scatter diagram developed in part (a) indicate about the relationship between the two variables? c. use the least squares method to develop the estimated regression equation (to 3 decimals). ŷ = + x d. for every additional car placed in service, estimate how much annual revenue will change. by $ e. fox rent a car has 11,000 cars in service. use the estimated regression equation developed in part (c) to predict annual revenue for fox rent a car. round your answer to nearest whole value. $ million hide feedback partially correct
Answers: 1
Business, 22.06.2019 11:00
T-comm makes a variety of products. it is organized in two divisions, north and south. the managers for each division are paid, in part, based on the financial performance of their divisions. the south division normally sells to outside customers but, on occasion, also sells to the north division. when it does, corporate policy states that the price must be cost plus 20 percent to ensure a "fair" return to the selling division. south received an order from north for 300 units. south's planned output for the year had been 1,200 units before north's order. south's capacity is 1,500 units per year. the costs for producing those 1,200 units follow
Answers: 1
You know the right answer?
Alternative a would involve substantial fixed but relatively low variable costs: fixed costs would...
Questions


Computers and Technology, 19.07.2019 23:20

Computers and Technology, 19.07.2019 23:20
Computers and Technology, 19.07.2019 23:20


