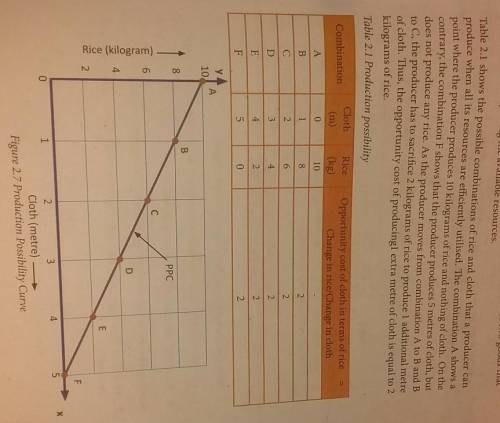
Hey guys help me with this. The graph mentioned below is production possibility cd of your own
...

Business, 26.05.2020 14:57 villafana36
Hey guys help me with this. The graph mentioned below is production possibility cd of your own
How would you
divide 24 hours among
different activities?
Illustrate with the help of a graph.
Your help will be appreciated
(The graph i have given is an example. Please help me create another graph asked in my question. I don't understand the graph)

Answers: 3


Another question on Business
Business, 21.06.2019 19:40
Anew equipment has been proposed by engineers to increase the productivity of a certain manual welding operation. the investment cost is $25,000, and the equipment will have a market value of $5,000 at the end of a study period of five years. increased productivity attributable to the equipment will amount to $10,000 per year after operating costs have been subtracted from the revenue generated by the additional production. if marr is 10%, is investing in this equipment feasible? use annual worth method.
Answers: 3
Business, 21.06.2019 20:40
Astock is selling today for $50 per share. at the end of the year, it pays a dividend of $3 per share and sells for $58. a. what is the total rate of return on the stock? (enter your answer as a whole percent.) b. what are the dividend yield and percentage capital gain? (enter your answers as a whole percent.) c. now suppose the year-end stock price after the dividend is paid is $42. what are the dividend yield and percentage capital gain in this case? (negative amounts should be indicated by a minus sign. enter your answers as a whole percent.)
Answers: 1
Business, 21.06.2019 23:30
The uno company was formed on january 2, year 1, to sell a single product. over a 2-year period, uno’s acquisition costs have increased steadily. physical quantities held in inventory were equal to 3 months’ sales at december 31, year 1, and zero at december 31, year 2. assuming the periodic inventory system, the inventory cost method which reports the highest amount for each of the following is inventory december 31, year 1/ cost of sales year 2 a: lifo fifo b: lifo lifo c: fifo fifo d: fifo lifo
Answers: 3
Business, 22.06.2019 02:00
What is an example of a good stock to buy in a recession? a) cyclical stock b) defensive stock c) income stock d) bond
Answers: 1
You know the right answer?
Questions


Social Studies, 25.12.2019 00:31

English, 25.12.2019 00:31

Social Studies, 25.12.2019 00:31

Spanish, 25.12.2019 00:31


Mathematics, 25.12.2019 00:31
Mathematics, 25.12.2019 00:31
Mathematics, 25.12.2019 00:31
Biology, 25.12.2019 00:31


