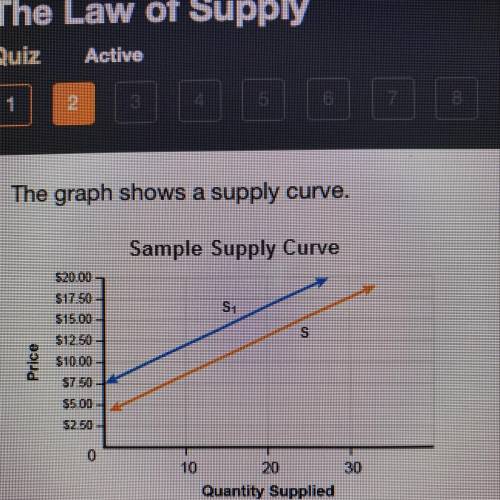
The graph shows a supply curve.
Which change is illustrated by the shift taking place on...

Business, 27.05.2020 05:03 shifaxoxoxo
The graph shows a supply curve.
Which change is illustrated by the shift taking place on this graph?
A. an increase in demand
B. a decrease in demand
C. an increase in supply
D. a decrease in supply

Answers: 3


Another question on Business
Business, 21.06.2019 19:10
Maldonia has a comparative advantage in the production of , while lamponia has a comparative advantage in the production of . suppose that maldonia and lamponia specialize in the production of the goods in which each has a comparative advantage. after specialization, the two countries can produce a total of million pounds of lemons and million pounds of coffee.
Answers: 3
Business, 22.06.2019 05:30
The struter partnership has total partners’ equity of $510,000, which is made up of main, capital, $400,000, and frist, capital, $110,000. the partners share net income and loss in a ratio of 80% to main and 20% to frist. on november 1, adison is admitted to the partnership and given a 15% interest in equity and a 15% share in any income and loss. prepare journal entries to record the admission of adison for a 15% interest in the equity and a 15% share in any income and loss under the following independent assumptions. (1) record the admission of adison with an investment of $90,000 for a 15% interest in the equity and a 15% share in any income and loss. (2) record the admission of adison with an investment of $120,000 for a 15% interest in the equity and a 15% share in any income and loss. (3) record the admission of adison with an investment of $80,000 for a 15% interest in the equity and a 15% share in any income and loss.
Answers: 1
Business, 22.06.2019 16:40
Job applications give employers uniform information for all employees,making it easier to
Answers: 1
Business, 22.06.2019 22:00
"jake’s roof repair has provided the following data concerning its costs: fixed cost per month cost per repair-hour wages and salaries $ 20,900 $ 15.00 parts and supplies $ 7.70 equipment depreciation $ 2,800 $ 0.35 truck operating expenses $ 5,720 $ 1.60 rent $ 4,690 administrative expenses $ 3,850 $ 0.50 for example, wages and salaries should be $20,900 plus $15.00 per repair-hour. the company expected to work 2,600 repair-hours in may, but actually worked 2,500 repair-hours. the company expects its sales to be $47.00 per repair-hour. required: compute the company’s activity variances for may."
Answers: 1
You know the right answer?
Questions

English, 03.03.2021 19:30


Business, 03.03.2021 19:30

Mathematics, 03.03.2021 19:30
History, 03.03.2021 19:30
Mathematics, 03.03.2021 19:30
Mathematics, 03.03.2021 19:30
Mathematics, 03.03.2021 19:30


