
Business, 24.06.2020 05:01 maddieb1011
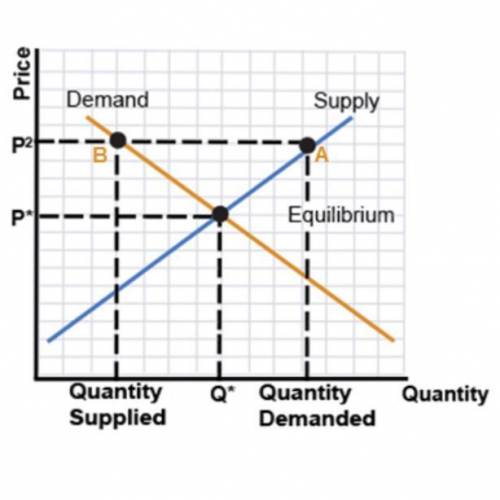
“A” represents the new quantity supplied, while “B” represents the new quantity demanded. What is the result of these changes?
equilibrium
supply shift
excess demand
excess supply
Based on this graph, what should happen to prices?
They should fall.
They should rise.
They should stay the same.
**PLEASE INCLUDE AN EXPLANATION!!

Answers: 1


Another question on Business
Business, 21.06.2019 16:30
Which of the following is the least effective way to reach a potential sales prospect? referral cold call direct mail personal visit
Answers: 3
Business, 22.06.2019 03:00
Afirm's before-tax cost of debt, rd, is the interest rate that the firm must pay on debt. because interest is tax deductible, the relevant cost of debt used to calculate a firm's wacc is the cost of debt, rd (1 – t). the cost of debt is used in calculating the wacc because we are interested in maximizing the value of the firm's stock, and the stock price depends on cash flows. it is important to emphasize that the cost of debt is the interest rate on debt, not debt because our primary concern with the cost of capital is its use in capital budgeting decisions. the rate at which the firm has borrowed in the past is because we need to know the cost of capital. for these reasons, the on outstanding debt (which reflects current market conditions) is a better measure of the cost of debt than the . the on the company's -term debt is generally used to calculate the cost of debt because more often than not, the capital is being raised to fund -term projects. quantitative problem: 5 years ago, barton industries issued 25-year noncallable, semiannual bonds with a $1,600 face value and a 8% coupon, semiannual payment ($64 payment every 6 months). the bonds currently sell for $845.87. if the firm's marginal tax rate is 40%, what is the firm's after-tax cost of debt? round your answer to 2 decimal places. do not round intermediate calcu
Answers: 3
Business, 22.06.2019 08:20
Which change is illustrated by the shift taking place on this graph? a decrease in supply an increase in supply o an increase in demand o a decrease in demand
Answers: 3
Business, 22.06.2019 17:00
Which represents a surplus in the market? a market price equals equilibrium price. b quantity supplied is greater than quantity demanded. c market price is less than equilibrium price. d quantity supplied equals quantity demanded.
Answers: 2
You know the right answer?
“A” represents the new quantity supplied, while “B” represents the new quantity demanded. What is th...
Questions

Mathematics, 13.01.2021 22:40

English, 13.01.2021 22:40
Mathematics, 13.01.2021 22:40
Mathematics, 13.01.2021 22:40

Mathematics, 13.01.2021 22:40


Chemistry, 13.01.2021 22:40

History, 13.01.2021 22:40

Social Studies, 13.01.2021 22:40
Spanish, 13.01.2021 22:40
English, 13.01.2021 22:40

Computers and Technology, 13.01.2021 22:40


