
Chemistry, 24.06.2019 21:10 edgarnino13
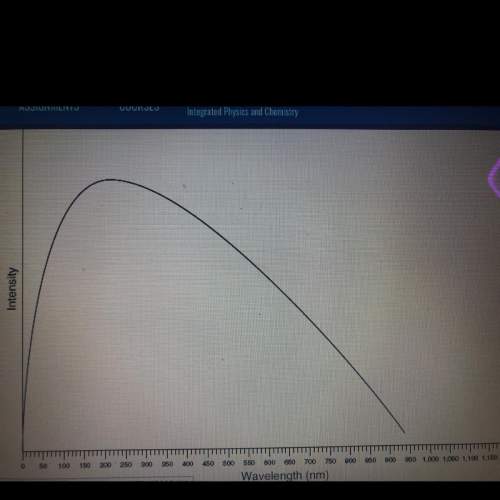
The blackbody curve for a star named beta is shown below. the most intense radiation for this star occurs in what spectral band? gamma rays ultraviolet visible infrared

Answers: 1


Another question on Chemistry
Chemistry, 21.06.2019 19:00
The skeletal system performs a variety of functions that are crucial to maintaining life processes. what function is performed in the bone marrow, but not in the ossified bones of the skeleton? a oxygen transportation c mineral storage b. muscle attachment d red blood cell production
Answers: 3
Chemistry, 22.06.2019 02:40
For a patient with the following pes statement and interventions, which would be the most appropriate monitoring and evaluating data? pes statement: inadequate calcium intake related to food and nutrition related knowledge deficit as evidenced by statements that the only dietary source of calcium is milk and she believes that she is lactose intolerant. patient’s nutrition prescription is for a diet providing 1200 mg calcium per day. patient was provided with in-depth nutrition education on alternative dietary and supplement sources of calcium. a. calcium intake (at subsequent visit) b. knowledge assessment by asking patient to identify food sources from menus and shopping list (at the end of the current visit) c. serum calcium (at next visit) d. both a and b e. both a and c
Answers: 2
Chemistry, 22.06.2019 05:50
Astudent made a graph plotting the progress of a reaction over time. the student forgot to label the y-axis of the graph. a graph is shown with two graph lines. one graph line starts at a higher position on the y axis and slopes downwards towards the right. the other graph line starts at a lower position on the y axis and slopes upwards towards the right. the two graph lines stop short of intersecting each other and continue as separate lines which gradually become straight and parallel to the x axis. a vertical line is shown at a point where the two graph lines finally became parallel to the x axis. this vertical line is labeled equilibrium. the title on the x axis is time and an arrow pointing towards the right is shown above time. the title on the y axis is left blank. what best explains the label that the student should use on the y-axis? amount, because as the amount of product decreases, the amount of reactant increases over time. reaction rate, because forward and backward reaction become equal at equilibrium. amount, because the amounts of reactants and products become constant after equilibrium is reached. reaction rate, as the rate of forward reaction increases and rate of backward reaction decreases over time.
Answers: 3
Chemistry, 22.06.2019 10:00
The reactions shown here can be combined to make the overall reaction c(s) + h2o(g) ⇌ co(g) + h2(g) by reversing some and/or dividing all the coefficients by a number. a. c(s) + o2(g) → co2(g) k=1.363×10^69 b. 2 h2(g) + o2(g) → 2 h2o(g) k=1.389×10^80 c. 2co(g) + o2 (g) → 2 co2(g) k=1.477×10^90
Answers: 1
You know the right answer?
The blackbody curve for a star named beta is shown below. the most intense radiation for this star o...
Questions

Mathematics, 11.02.2021 07:20

Mathematics, 11.02.2021 07:20
Mathematics, 11.02.2021 07:20
Mathematics, 11.02.2021 07:20

Mathematics, 11.02.2021 07:20


Social Studies, 11.02.2021 07:20
Mathematics, 11.02.2021 07:20
Mathematics, 11.02.2021 07:20

History, 11.02.2021 07:20

Mathematics, 11.02.2021 07:20
Mathematics, 11.02.2021 07:20
Mathematics, 11.02.2021 07:20
Mathematics, 11.02.2021 07:20


